

Every Monday, I share my first take on 2 to 3 interesting opportunities.
As usual, if you want me to dig deeper into an idea, vote for it. Use the poll at the end of this email.
B&M European Value Retail plc (BME LN)
About (26 Aug 2026)
Share price: GBP 2.46
Market capitalisation: GBP 2,470 mn (USD 3,357 mn)
Enterprise value (EV): GBP 4,574 mn (USD 6,216 mn)
Average daily volume (ADV): GBP 14 mn (USD 19 mn)
NTM P/E: 11x
I estimate 10% free cash flow yield on enterprise value. ~5% premium over UK 10y gilt. Looks attractive.
BME is one of the largest discount retailers in the UK.
Its largest segment, B&M UK accounts for 80% of its revenue with GBP 4,615 mn revenue across 799 stores.
Good business, temporary headwinds?
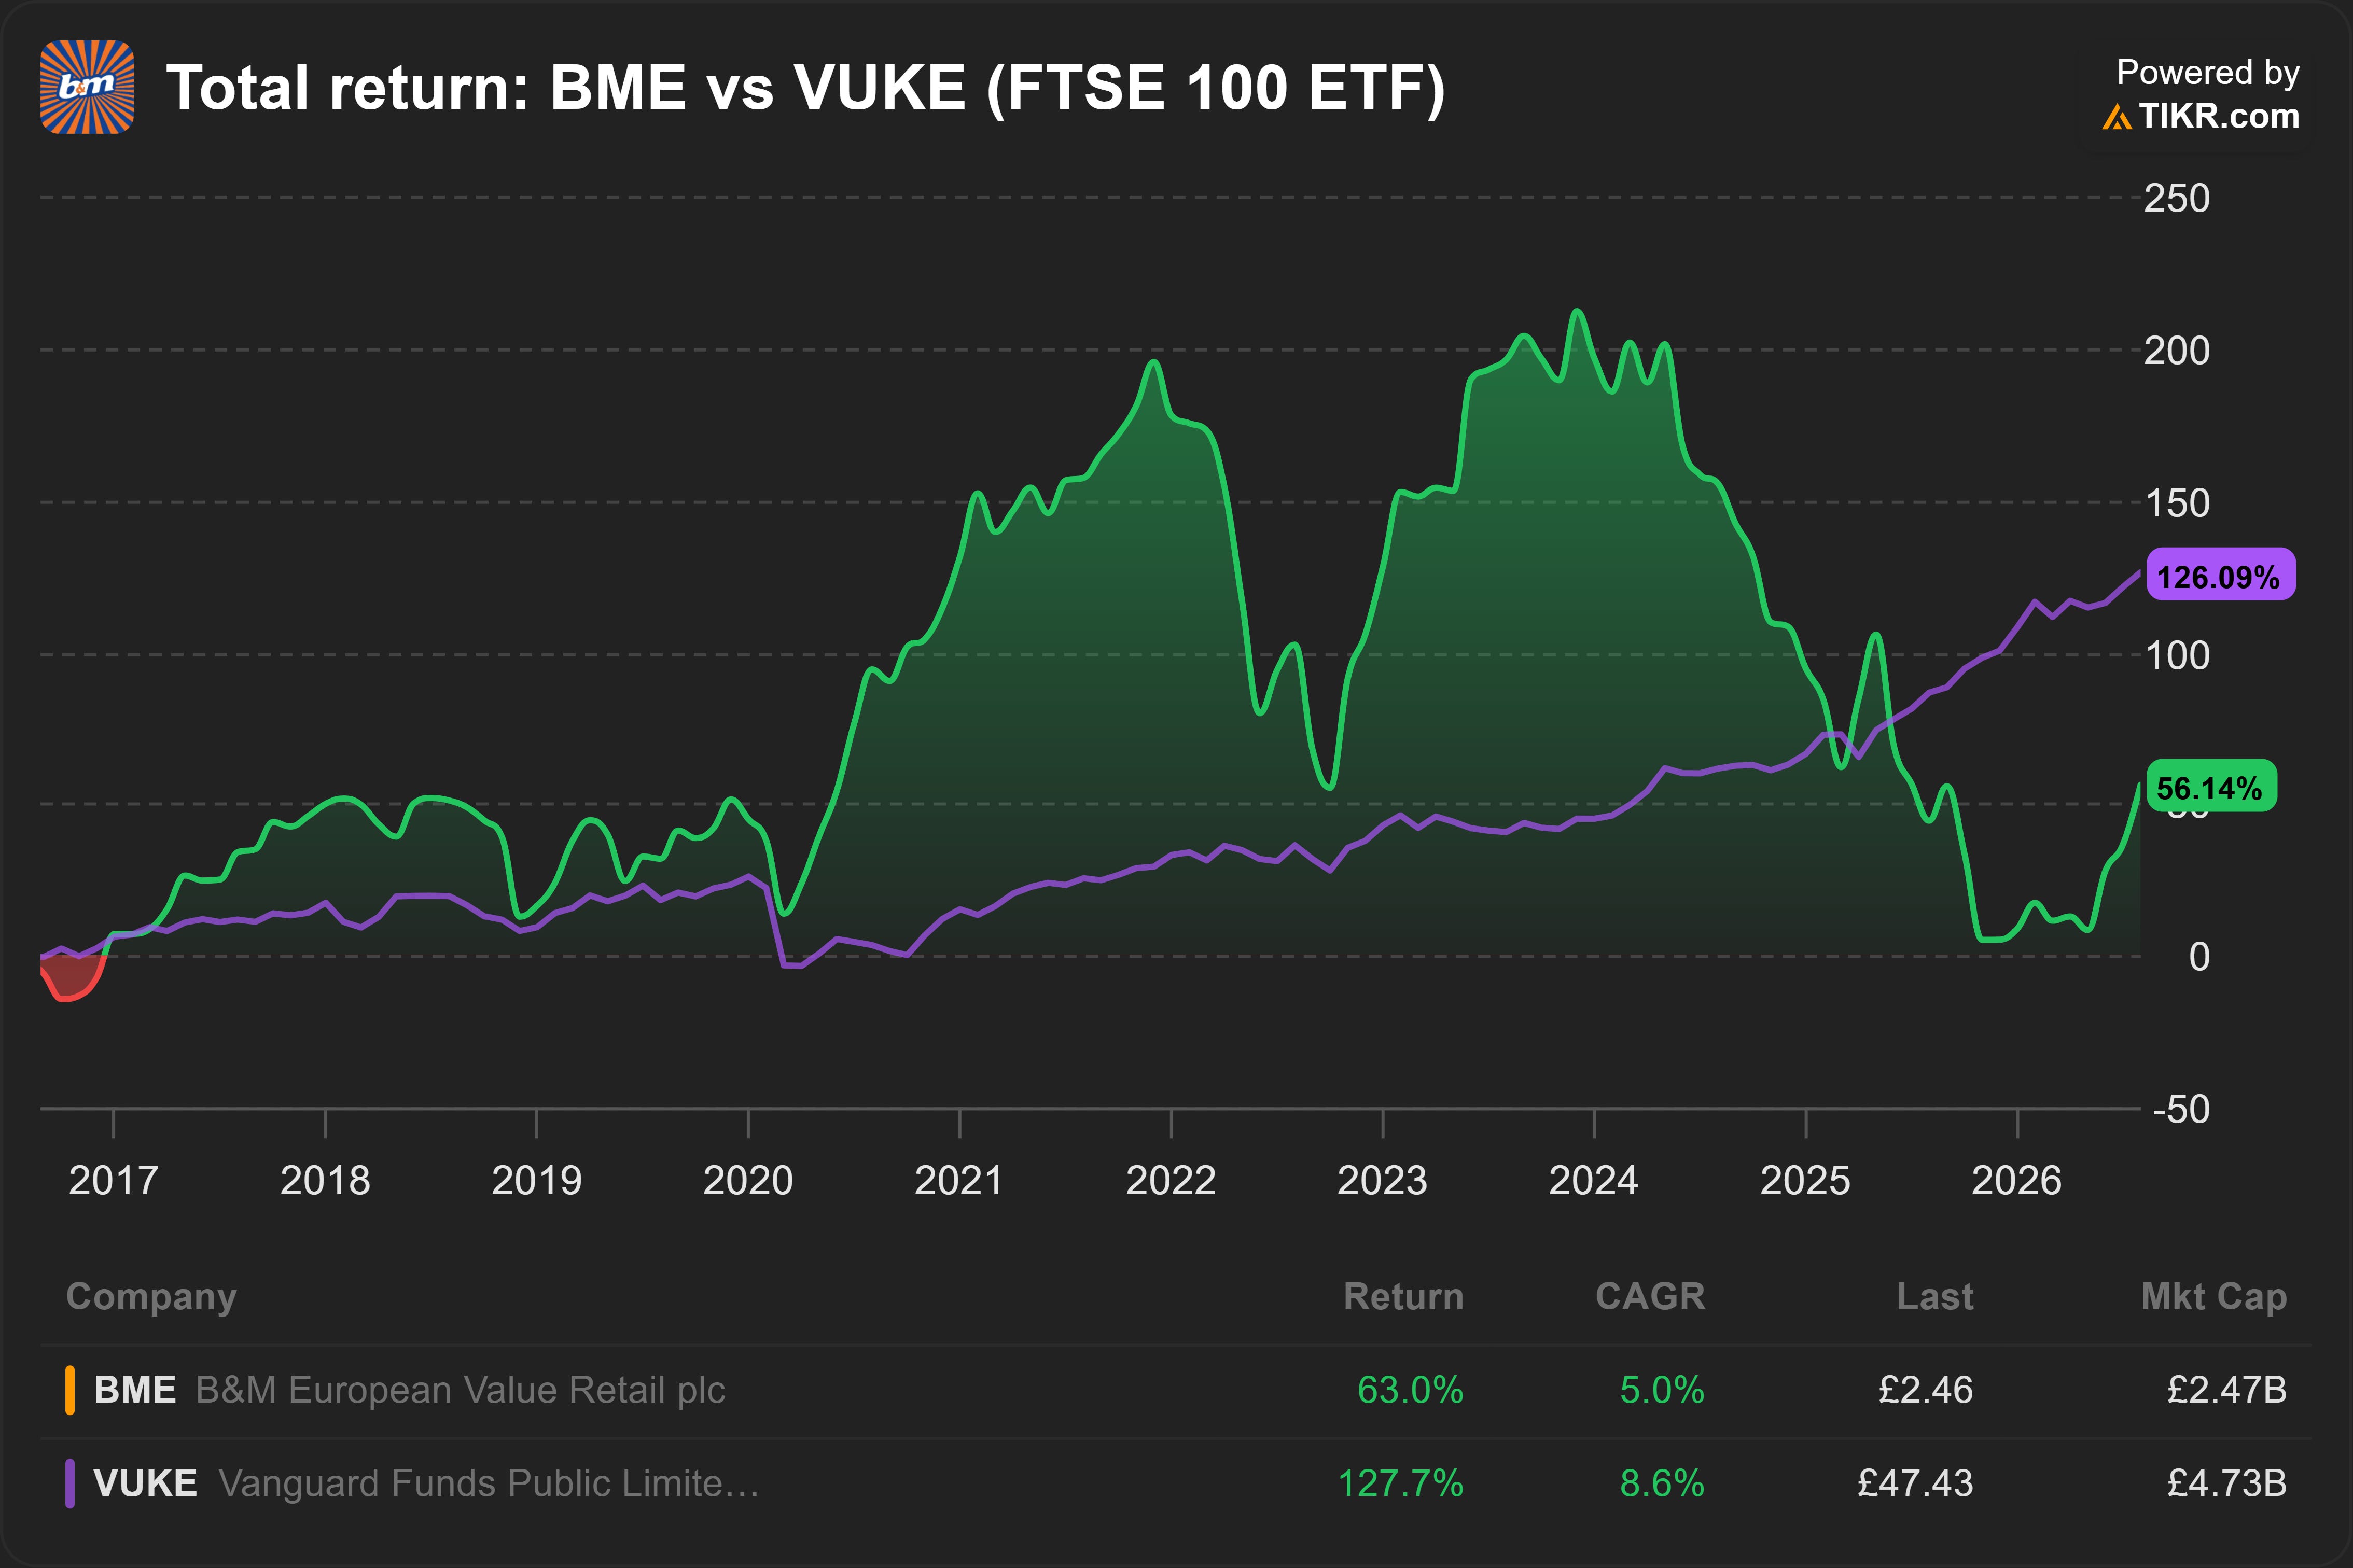
From mid-2024 to late-2025, BME’s share price fell almost -70%.
Negative same store sales. Inventory piled up. Gross profit margin (GPM) fell.
What’s going on?
When a retailer has the wrong inventory at the wrong prices, same store sales drop and inventory starts piling up.
The retailer has to cut prices until they clear out the excess inventory. Gross profit margins (GPM) suffer.
Once the retailer has cleared out the excess inventory, fixed the product range and prices, same store sales and GPM are ready to recover.
I suspect this is what’s happening at BME.
New CEO Tjeerd Jegen came in June 2025. The company started simplifying its product range and cutting excess inventory. To restore their reputation as a discount retailer, BME also cut prices on key products.
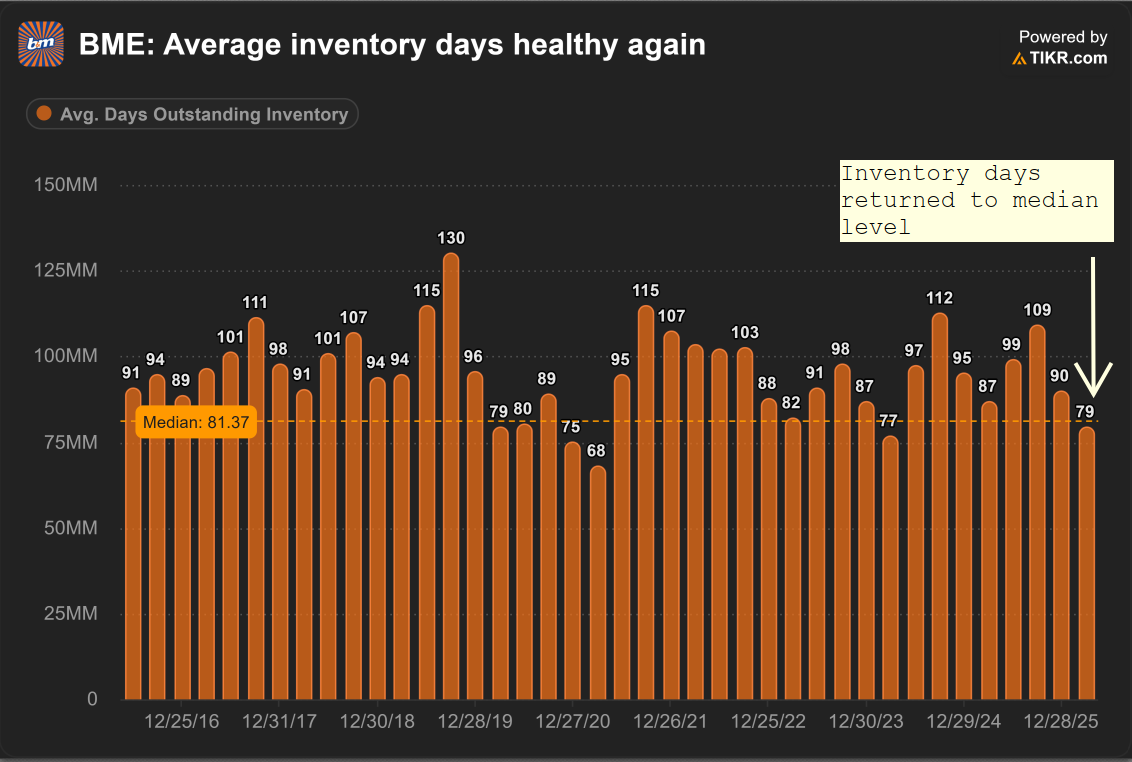
By March 2026, the company has restored inventory days to a healthy level again.
In FY2026 annual report, management quietly raised their expectations of GPM improvement and same store sales for B&M UK:
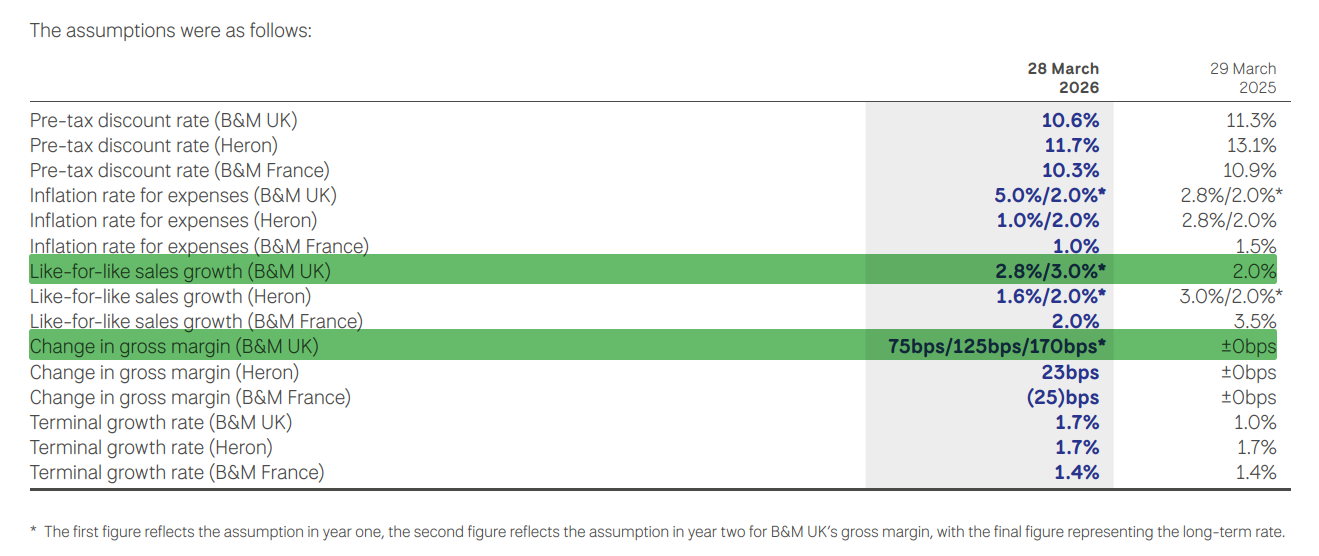
Source: BME (2026)
Yet, it looks like most investors are still pessimistic.
Sell-side consensus forecasts GPM to fall slightly over the next 3 years. They also expect revenue growth of only between 3.0% to 4.5% per year.
If BME achieves 3% same store sales, and continues increasing store count by 3% per year, the company can reach 6% annual revenue growth.
Factors to focus on
How sustainable is the recovery in same store sales and gross profit margins?
In the latest quarter, B&M UK same store sales turned negative. Management said this is because unusually warm weather led to strong garden sales last year. Is this reasonable?
Elan Corporation (6099 JP)
About (26 Aug 2026)
Share price: JPY 760
Market capitalisation: JPY 45,969 mn (USD 288 mn)
Enterprise value (EV): JPY 39,738 bn (USD 249 mn)
Average daily volume (ADV): JPY 68 mn (USD 0.4 mn)
NTM P/E: 14x
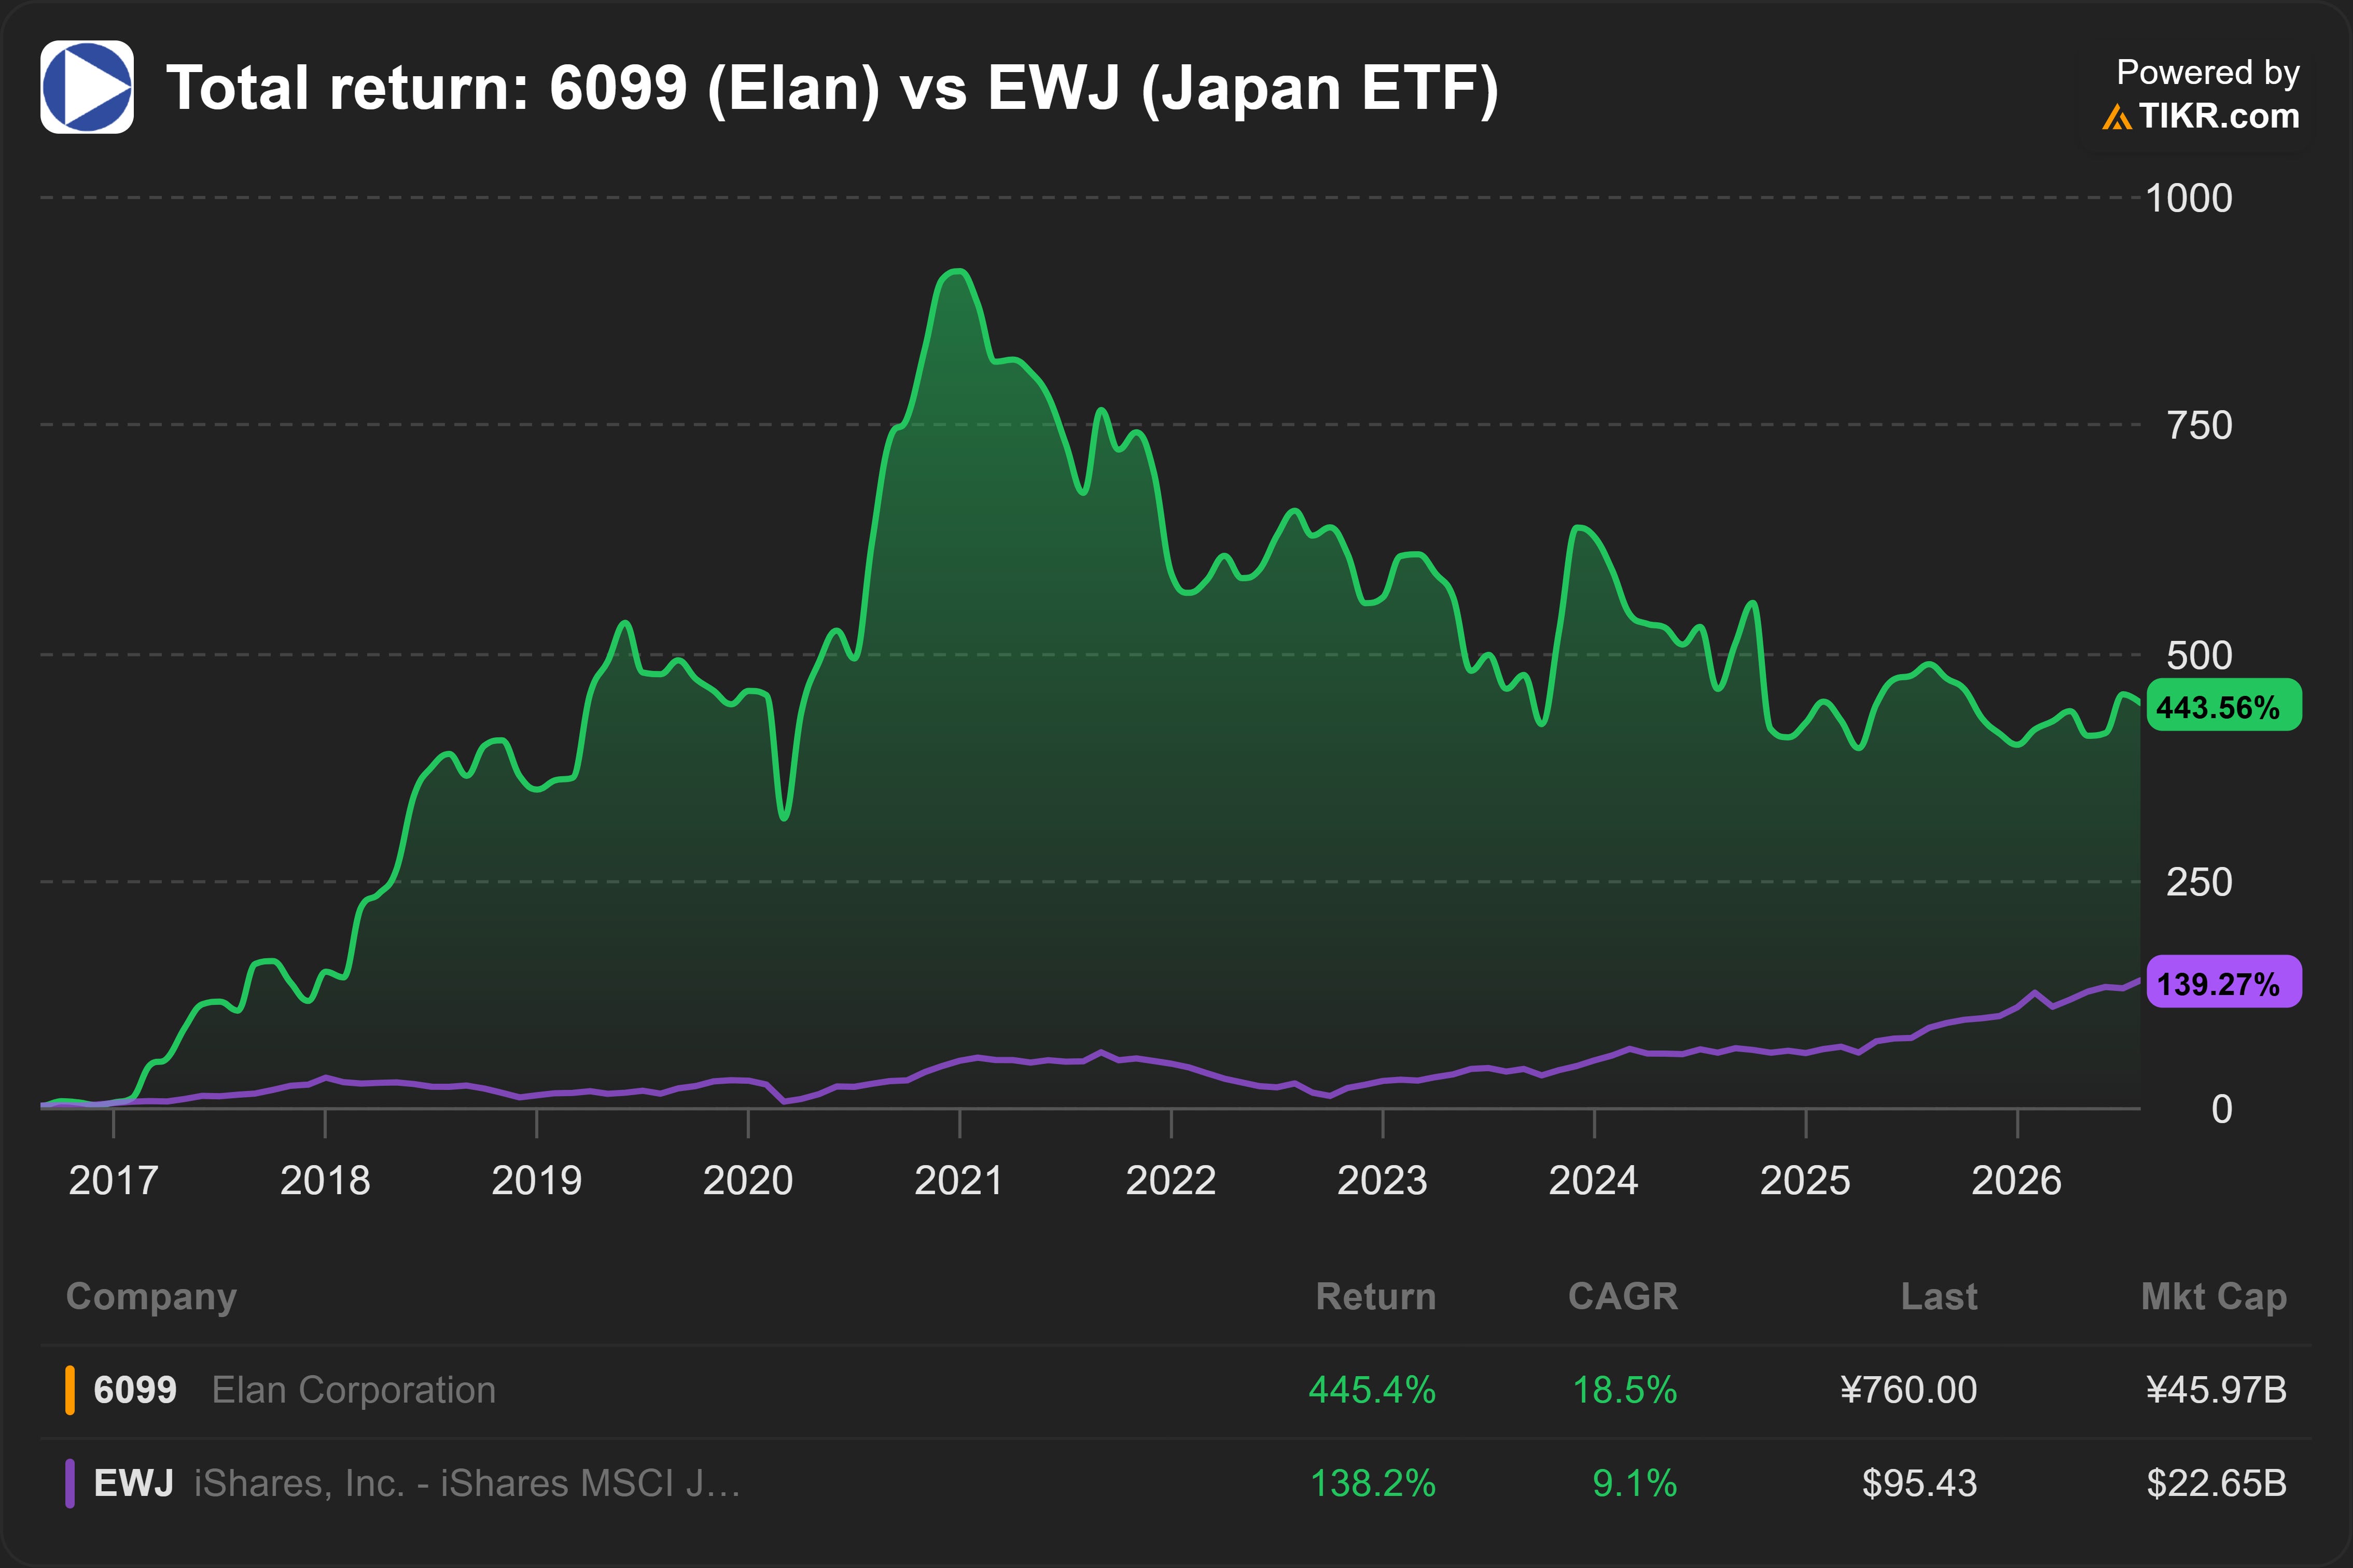
My initial estimate suggests ~9% free cash flow yield on enterprise value. ~6% premium over the Japan 10y government bond yield. Looks attractive.
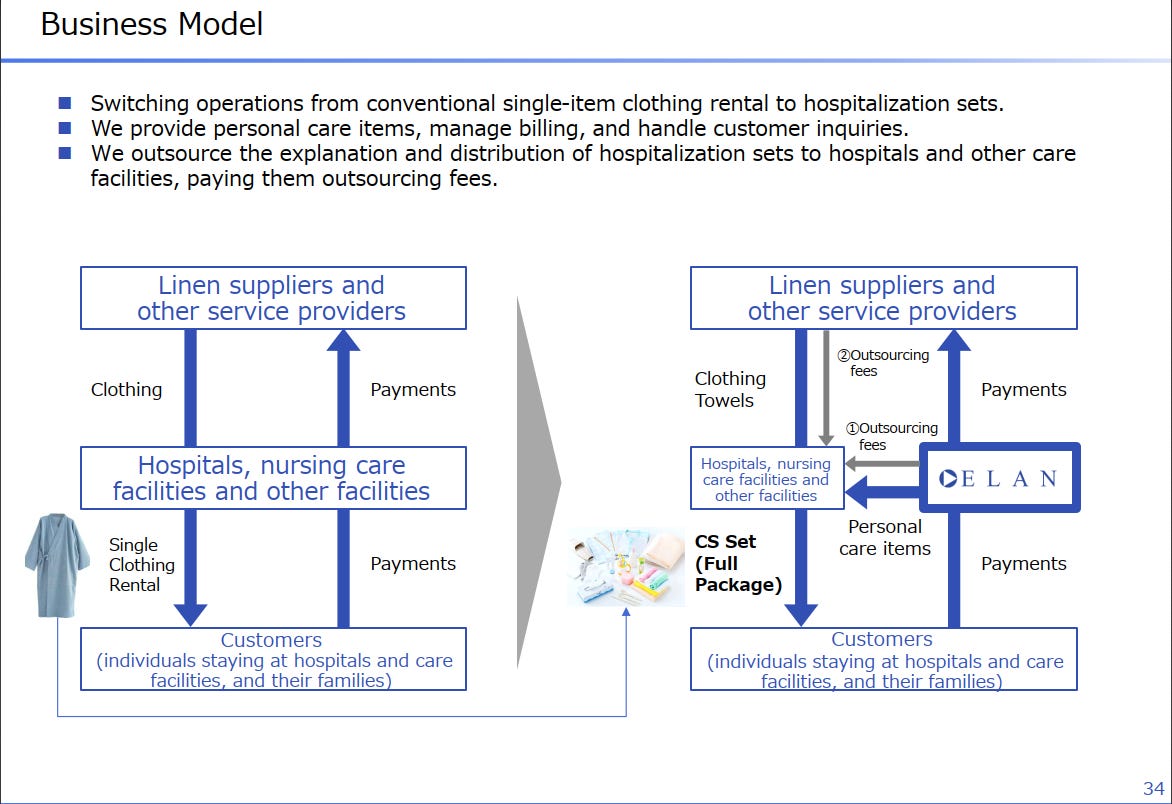
Elan’s main product is the Care Support (CS) Set.
This provides daily necessities like pajamas, towels, diapers, and toiletries to hospitalised patients and nursing home residents.
Source: Elan (2026)
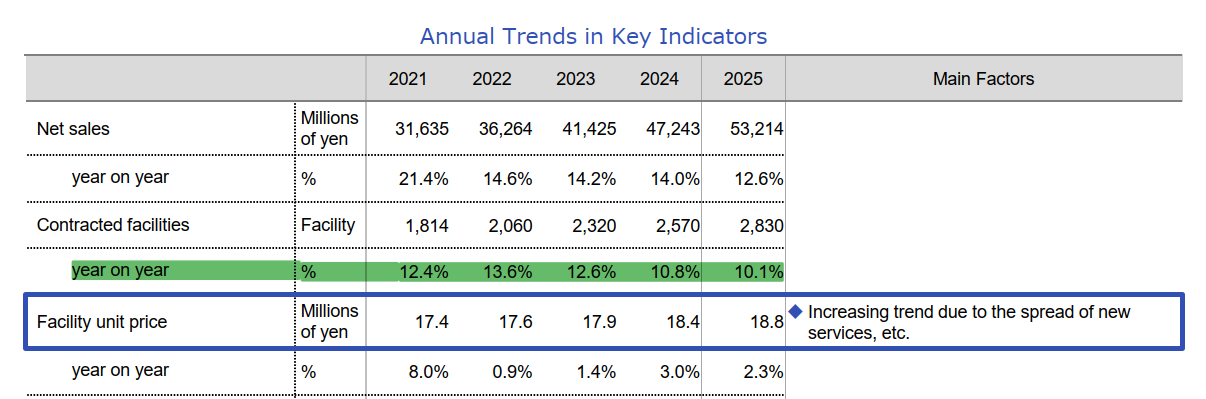
Revenue growth is driven by increasing penetration rate:
Source: Elan (2026)
Under-recognised growth?
Elan targets +15% annual revenue growth between 2026 and 2028. They expect to hit this target through ~10% organic growth and M&A.
This target looks reasonable. Elan remains underpenetrated in Japan.
As of H2’26, penetration rate is only ~26% compared to their long-term target of 41%. Achieving this target within the next 5 years would mean ~10% organic revenue growth per year.
Higher prices alone are contributing low-single digit revenue growth.
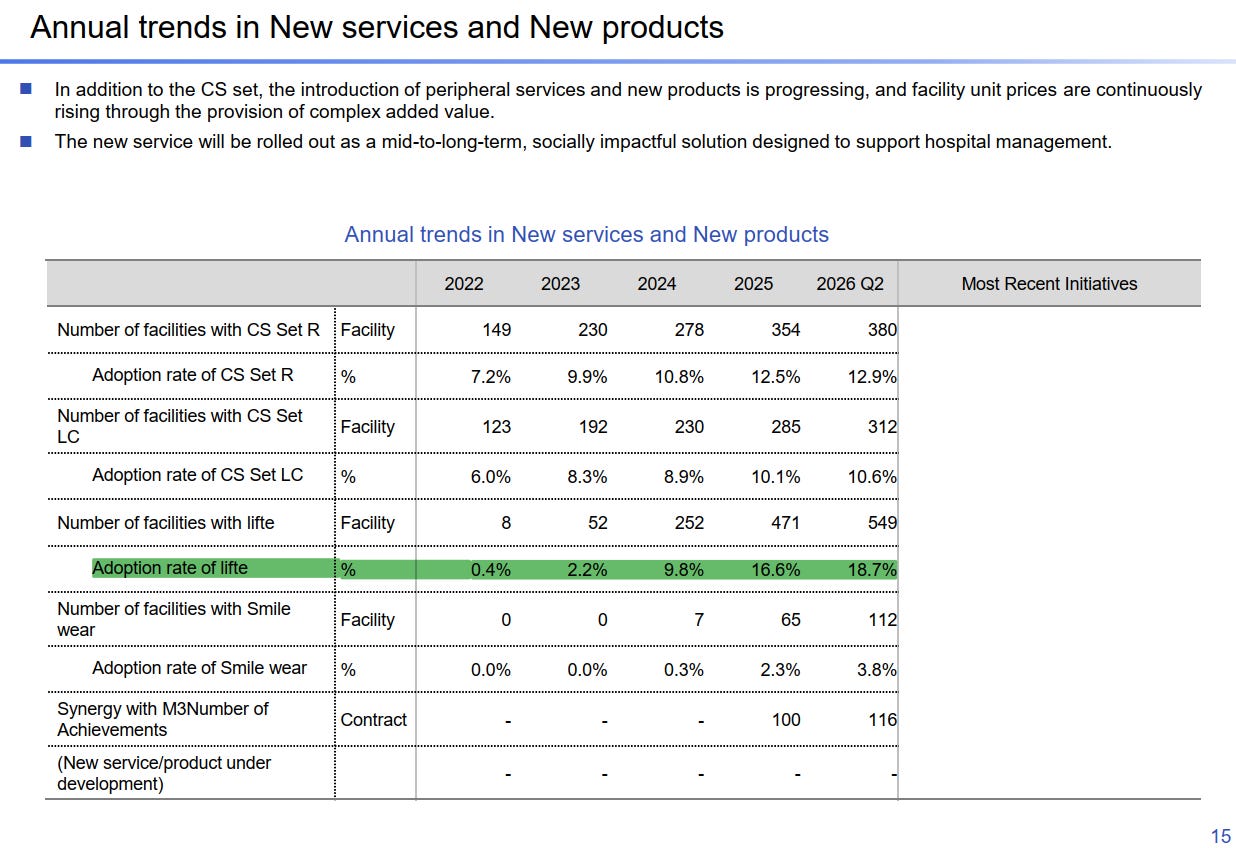
Elan introduced new premium services like lifte. This is the company’s proprietary brand of high-quality, original patient wear and gowns.
The adoption rate is growing fast from a low base:
Source: Elan (2026)
~9% FCF yield seems too cheap for a business that can grow at such levels.
Why would this opportunity exist?
Nobody’s looking. I can’t find any major sell-side coverage.
Potential sale?
In October 2024, M3, Inc. (2413 JP) acquired 55% of Elan. It paid JPY 1,040 per share. This is ~37% higher than today’s share price.
On 18 August 2026, activist investor Oasis Management raised its shareholding in M3 to 6.26%.1
Oasis demanded, among several things:
Transfer, acquisition or suspension of part of the business
Significant change to dividend policy
Given the pressure, M3 may sell Elan to fund special dividends to its shareholders.
Elan’s operating profits are only 6% of M3’s. The synergy is not obvious. It’s almost 2 years after the acquisition. Yet, the company only got 116 contracts through M3’s distribution network. Elan has a total of 2,830 contracts.
Factors to focus on
Probability of management achieving their revenue growth targets (organic and inorganic)
Vote for the best idea
If you want me to dig deeper into an idea, vote for it.
Coming up next
I will look deeper into Nine Entertainment (NEC AU) this week. This was the idea you voted the most interesting in my previous email.
NEC owns Stan, Australia’s homegrown streaming service. This streaming service alone could be worth between AUD 1,600 mn and AUD 3,700 mn.
Yet, NEC trades at only AUD 1,656 mn. It still owns other assets like the Channel 9 television and major newspapers like The Sydney Morning Herald (SMH).
Maybe that’s why the largest shareholder is gradually increasing its stake. Potential takeover?
Subscribe to get the analysis when I publish.
Subscribe for 2 to 3 analyses of global SMID equities every week.
Discover overlooked ideas and rethink familiar names.
Published by Andrew Wong, ACA, CFA
In case you missed it
Last week, I highlighted the opportunity I am seeing in Genting Malaysia: Another Double-Bagger?
Revenue set to double by 2031. Hidden assets worth ~ 73% of market cap.

One of the smartest analysts I knew showed me how to gain forward-looking insights from accounting footnotes.
If NEL NO investors had paid attention to the property, plant and equipment footnote, they could have avoided a 90% loss.
“Accounting is useless. Backward-looking”

It’s 2019. Green hydrogen promises to revolutionise the world.
Disclaimer
This publication is for informational, educational, and entertainment purposes only and does not constitute financial, investment, legal, or tax advice. The content herein is a record of my personal research and investment process, and all analysis, forecasts, and opinions expressed are solely my own.
I make no representation or warranty, express or implied, as to the accuracy, completeness, or timeliness of the information provided. The stock market is highly volatile, and my forecasts, estimates, and assumptions may prove incorrect.
I am not acting as your financial advisor or fiduciary. You should not rely on any information in this publication to make investment decisions. Under no circumstances will I be held liable for any direct, indirect, or consequential losses or damages arising from your reliance on the content of this publication.
At the time of publication, I do not hold any positions in 6099 JP and 2413 JP, either long or short. I hold shares in BME LN. I may change my views, predictions, or personal portfolio positioning at any time without notice.