
Xinyi Solar: Poised for another upcycle?
[Shortlist] Xinyi Solar Holdings Limited (968 HK)

Summary
I decided to shortlist.
Xinyi Solar seems to be approaching a cyclical inflection.
The industry has been cutting capex. Demand likely to grow above expectations. Gross margins are bottoming out. Working capital shows favourable trends.
About (14 May 2026)
Share price: HKD 3.09
Market capitalisation: HKD 28,264 mn (USD 3,608 mn)
Enterprise value (EV): HKD 42,668 mn (USD 5,447 mn)
Average daily volume (ADV): HKD 185 mn (USD 23 mn)
NTM P/E: 14x; LTM P/B: 0.9x
Time spent: ~1 day
My decision
This is a record of my investment decisions, not financial advice. Read the full disclaimer at the end.
Shortlist
Background
Xinyi Solar is the world’s largest maker of solar glass.
In the most recent shortage, its share price jumped almost 5x and peaked around HKD 20.
Today, it trades at HKD 3. The collapse reflects the severe glut in the solar industry.
Most investors have written off another upcycle.
But there are some signs that the company has reached the cycle trough and may be approaching an upcycle.
In this post, I will explain these in detail.
Business model
Xinyi Solar makes the glass that covers solar panels.
Xinyi Solar holds ~30% worldwide market share by production capacity. Its closest competitor, Flat Glass, holds ~20% market share.1
Breakdown of FY2025 revenue (CNY 20,861 mn; -5% YoY):
85% Solar Glass (-5% YoY)
14% Renewable Energy (-1% YoY)
1% Others (-57% YoY)
The Solar Glass segment produces the glass that covers solar panels. Solar glass is designed specifically to protect solar cells from harsh weather while maximizing the amount of sunlight that passes through.
The Renewable Energy segment develops and operates solar and wind power farms. It generates revenue by selling the electricity to local power grids and industrial users, supplemented by government tariff subsidies.
In 2025, Xinyi Solar earned 71% of its revenue from Mainland China, 20% from other parts of Asia, 7% from North America and Europe and 2% from others.
North America and Europe is the fastest growing region (+123% YoY), followed by other parts of Asia (+25% YoY). Mainland China declined -15% YoY.
Xinyi Solar’s main customers for its solar glass are major global solar panel manufacturers such as LONGi Green Energy Technology Co., Ltd. (601012 CH) and JinkoSolar Holding Co., Ltd. (JKS US).
Sales to the top 1 customer contributed 12% to total revenue while sales to the top 5 customers contributed 44%.
The closest public comparable is Flat Glass Group Co., Ltd. (6865 HK), the second largest solar glass maker in the world.
My reasons
Cyclical inflection?
Capex cuts. Cash capex in the industry peaked in 2022 and has been trending down ever since.
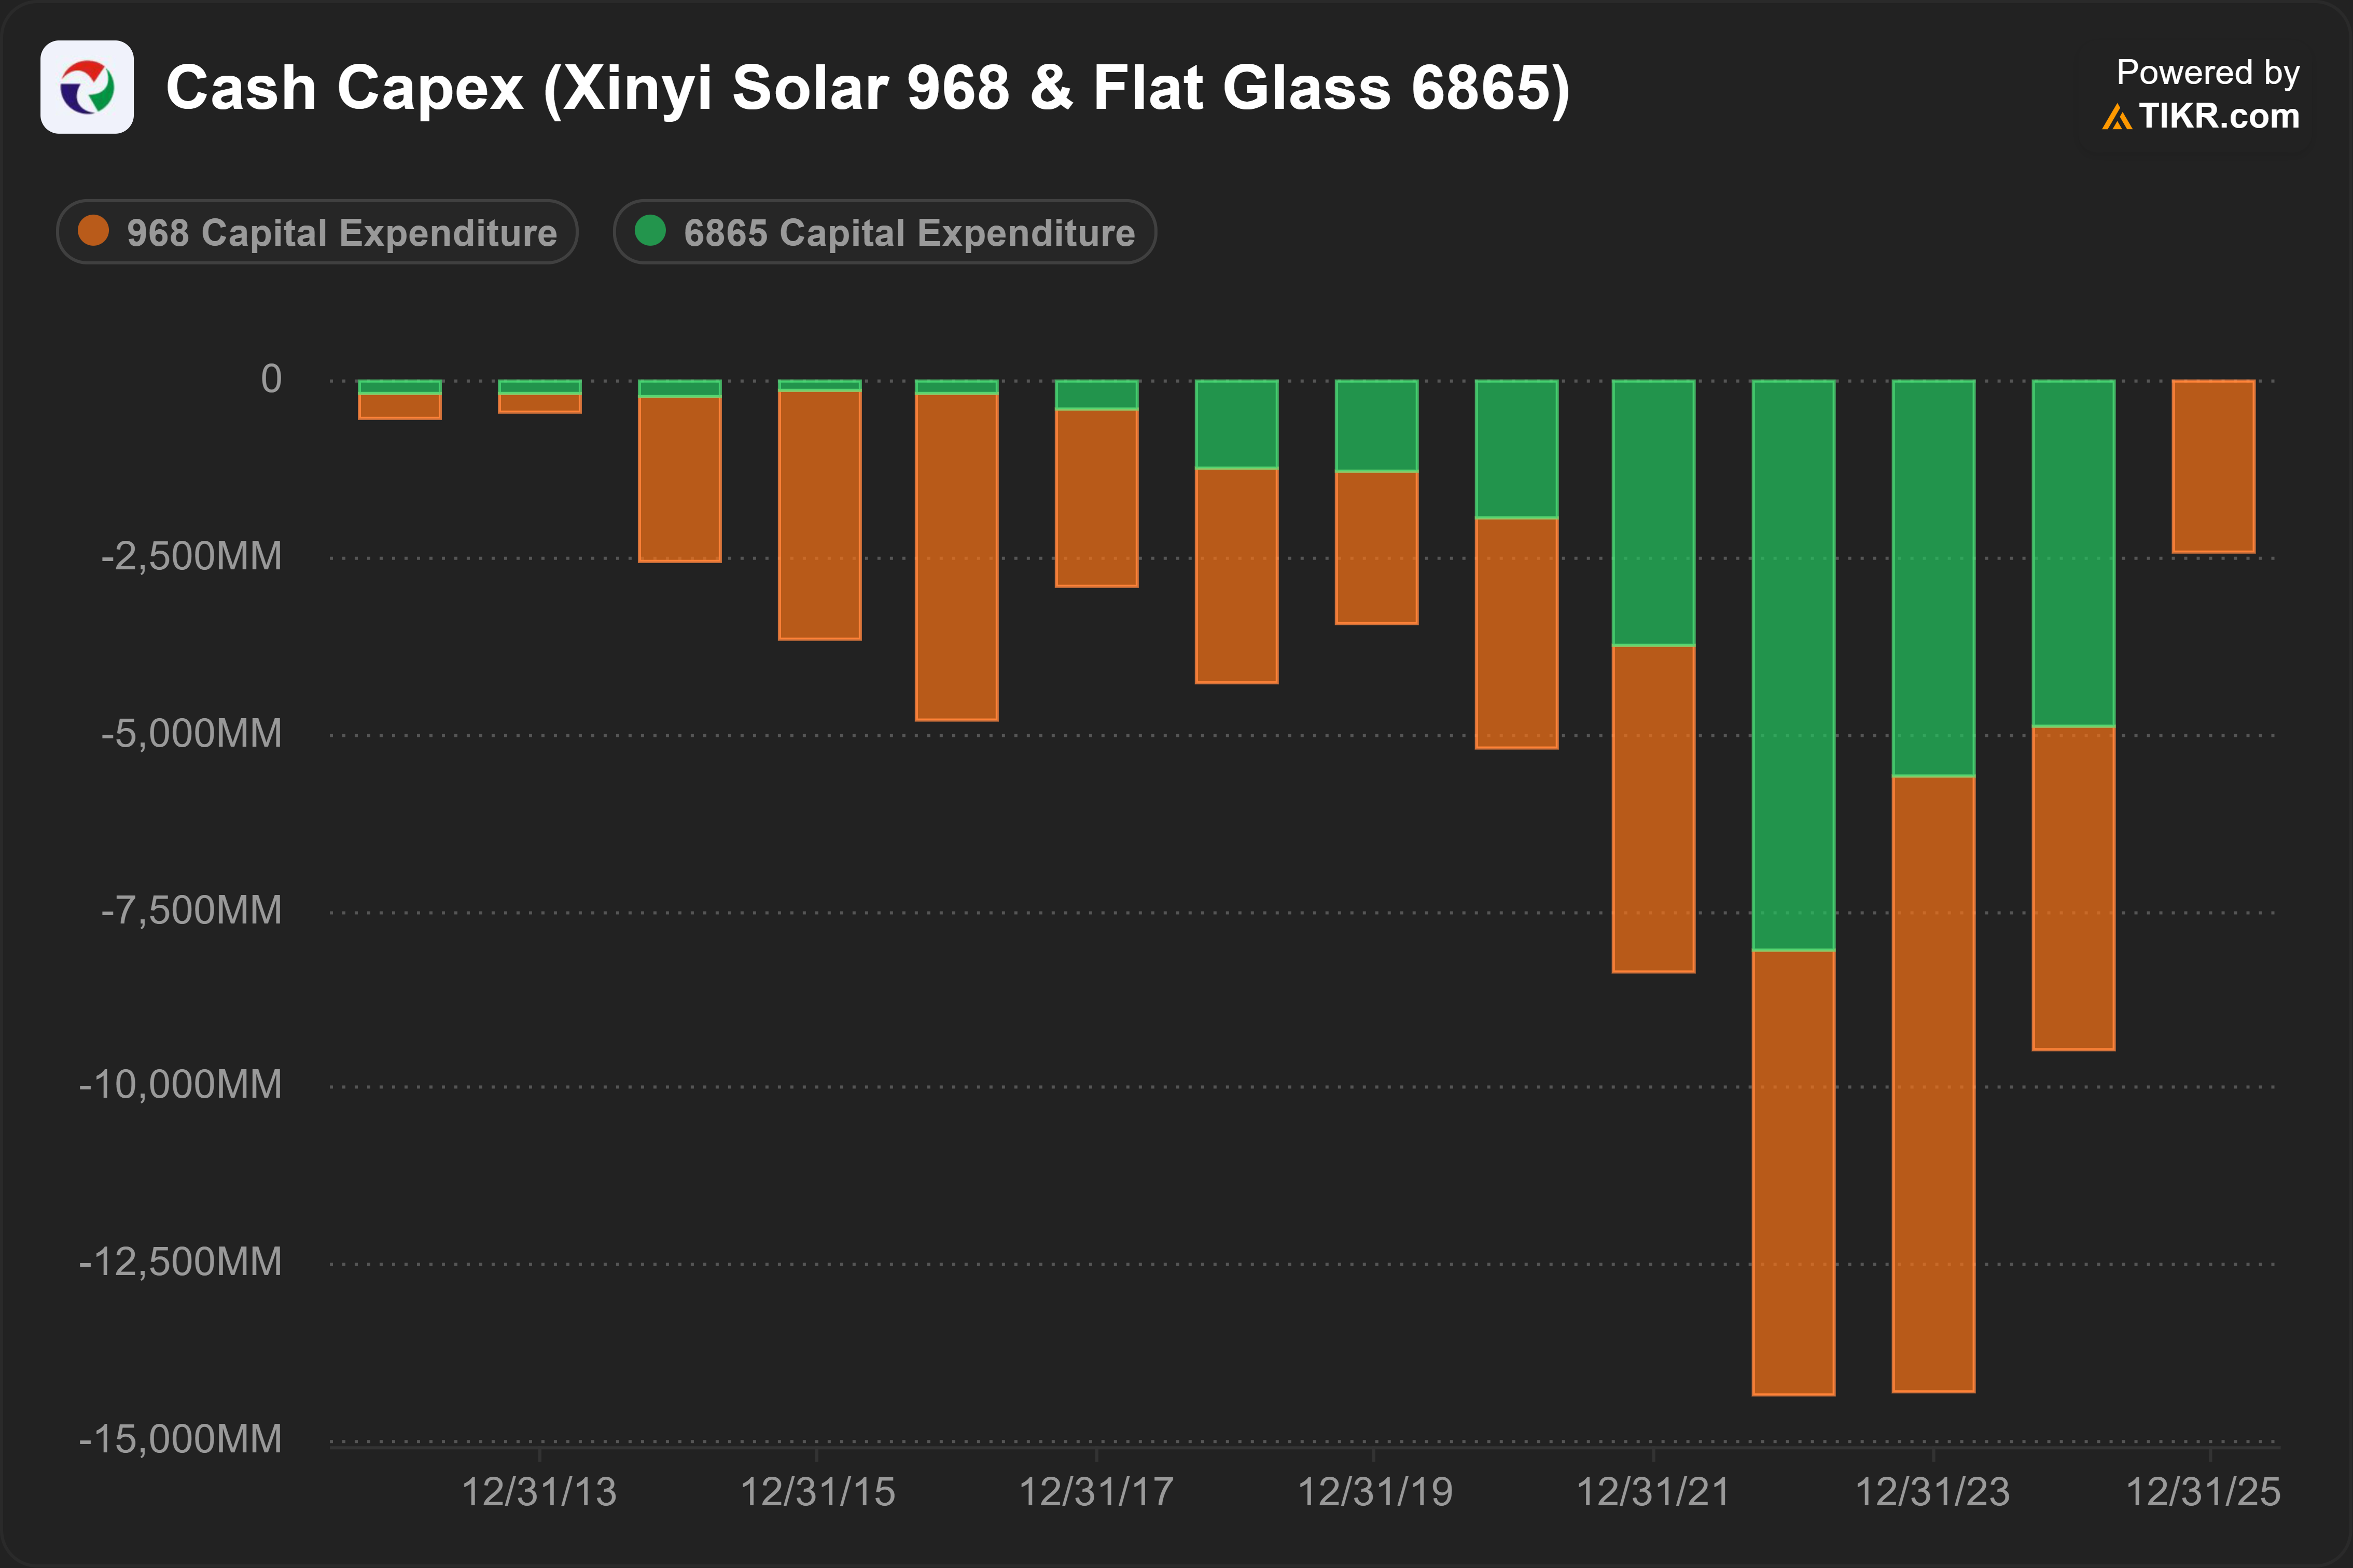
In 2025, Flat Glass’s cash capex (green) declined to CNY 3,000 mn from CNY 5,000 mn. The chart could not display this. Source: Tikr (2026)
Capex in 2026 will likely be lower too. As of 31 Dec 2025, Xinyi Solar’s contracted capex for 2026 declined by -36% YoY.
Consensus often underestimates demand. It is no secret that the solar industry is in a severe oversupply.
Not too long ago, I casually mentioned the solar industry might be interesting, only to be curtly cut off by a portfolio manager, “Do you know how many people lost their job because of solar companies?”
The media likes to quote the International Energy Agency (IEA)’s report that “In 2024, there was sufficient manufacturing capacity to have produced more than twice as many solar PV modules as were actually deployed”2
However, the consensus often underestimates demand growth. The orange hairy lines below illustrate this.
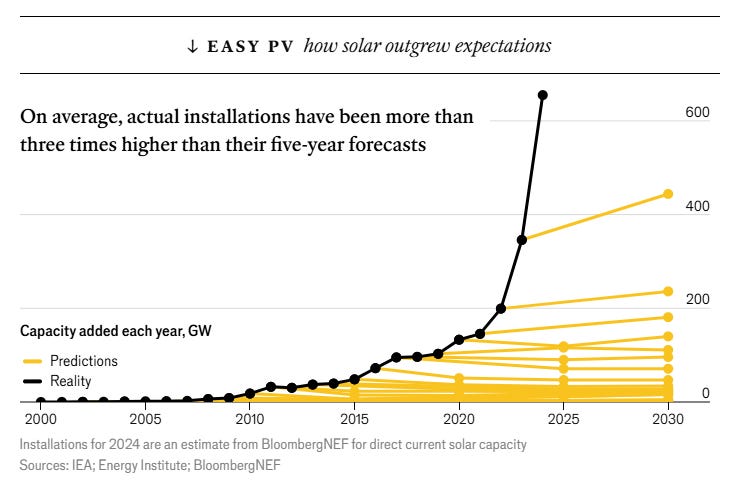
Source: The Economist (2024)
In 2025, the growth in annual installation decelerated to +12% YoY.3
However, there are two reasons why demand growth will likely re-accelerate.
Higher-than-expected oil prices. The Economist argues that investors are underestimating the crisis in the oil markets. “Even in the most optimistic scenario, the world will continue to suffer a severe shortfall in supply for several more months.”4
If the Economist is right, solar energy will become more attractive. In fact, even before this crisis, solar was already cheaper. In 2025, solar energy was 41% cheaper on average than the lowest-cost fossil fuel alternatives.5
Already, we are seeing early signs of acceleration in exports:
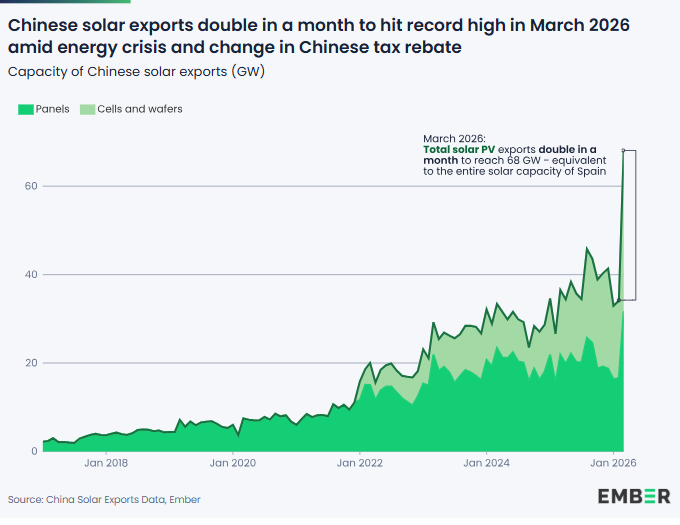
Source: Ember (2026)
To be fair, the expiration of export tax rebate in Apr 2026 also contributed to the export surge in Mar 2026. Data for Apr 2026 will give a clearer picture.
Higher for longer oil prices will likely re-accelerate the demand for solar panels.
Declining cost of battery energy storage systems (ESS). The penetration of solar energy has historically been curtailed by its lack of dispatchability. Grid operators cannot easily adjust solar output to match demand because electricity is only generated when the sun is shining.
As a result, solar cannot act as a reliable baseload power source. This is a huge disadvantage. Natural gas or diesel power plants can quickly ramp their electricity production up or down to match fluctuating market needs.
The obvious solution is to store the solar energy and release it according to electricity demand. In the past, this was not very commercially feasible. Battery ESS is expensive.
However, the declining cost of battery ESS is starting to change this.
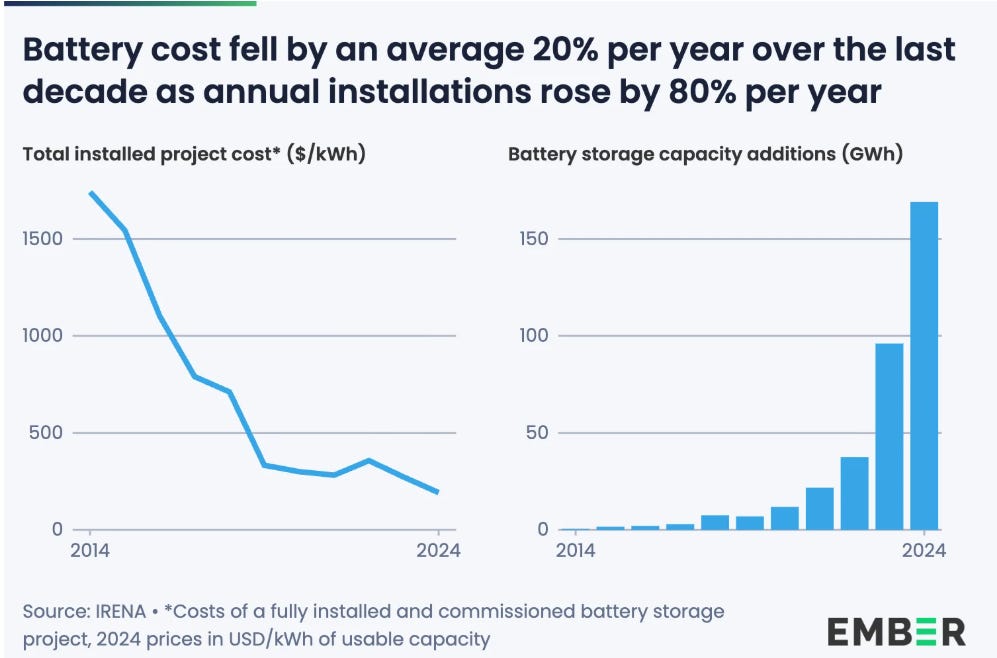
Source: Energy Storage News (2025)
In May 2026, the International Renewable Energy Agency (IRENA) reported that, in certain regions, solar energy with battery storage is already delivering cost-competitive electricity compared with coal and gas.6 IRENA expects the gap to widen further.
All these factors suggest demand for solar panels will likely re-accelerate. Coupled with capex cuts, the current oversupply in the solar industry will likely end sooner than expected.
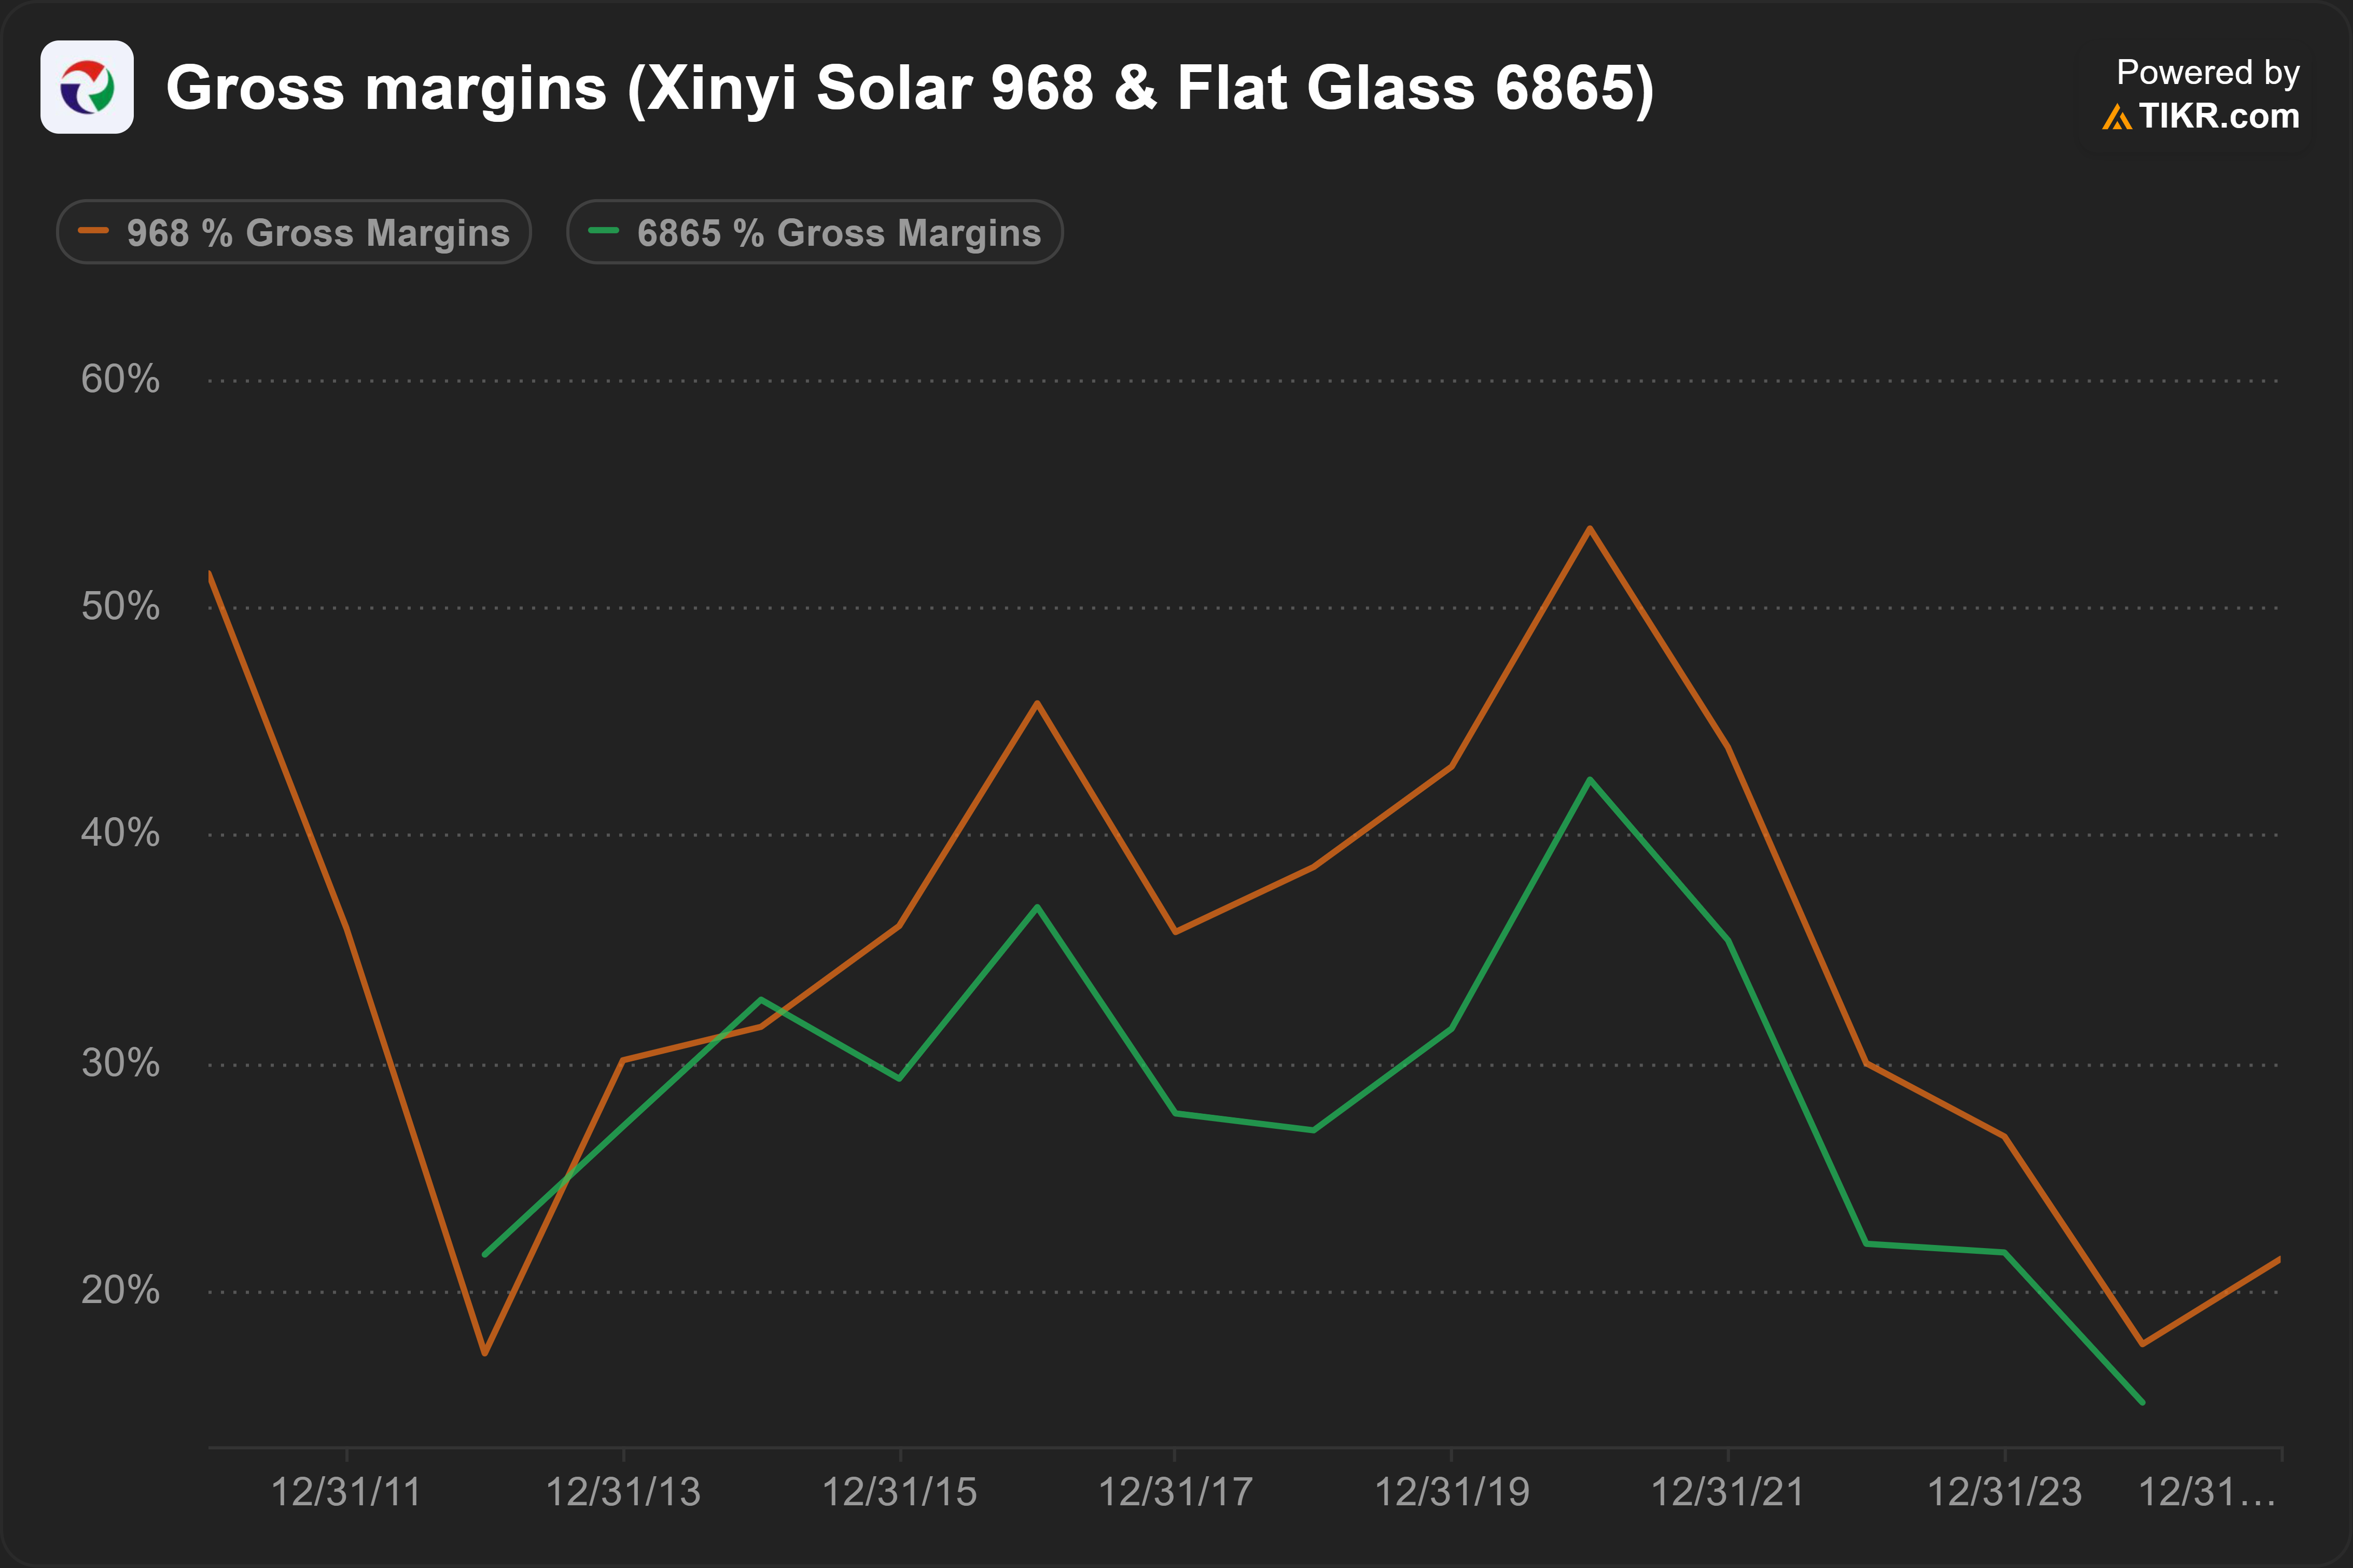
Gross margins bottomed out. Already, we are seeing some early signs of cyclical inflection. Gross margins for both Xinyi Solar and Flat Glass reached all-time low in 2024 before recovering slightly in 2025.
Gross margins appeared to have bottomed out. In Q1’26, Flat Glass’ gross margin improved to 14%, up from 12% a year ago. Xinyi Solar has not reported Q1’26, but will likely show a similar improvement.
Flat Glass’ gross margin (green) also recovered in 2025, reaching 16%, up from 15% in 2024. The chart could not display this. Source: Tikr (2026)
Favourable working capital trends. Xinyi Solar’s working capital trends suggest an inflection point may be approaching.
After declining -30% in 2023, contract liabilities (advance payment from customers) grew +3% in 2024. The growth accelerated to +14% in 2025. Although the absolute amount is immaterial, the trend in contract liabilities has historically been a good leading indicator of revenue growth.
Receivable collection improved in Q4’25, with average receivable days declining from a near all-time high in the prior quarter.
When customers start settling their bills and even pay for some orders in advance, an inflection is likely approaching.
Finally, inventories decreased -40% in 2025, much faster than the -5% decline in revenue. The inventory drawdown was concentrated in finished goods.
Factors to focus on
Where are we in the solar cycle? Xinyi Solar’s share price trades in line with LONGi, one of the world’s largest solar wafer and panel makers.
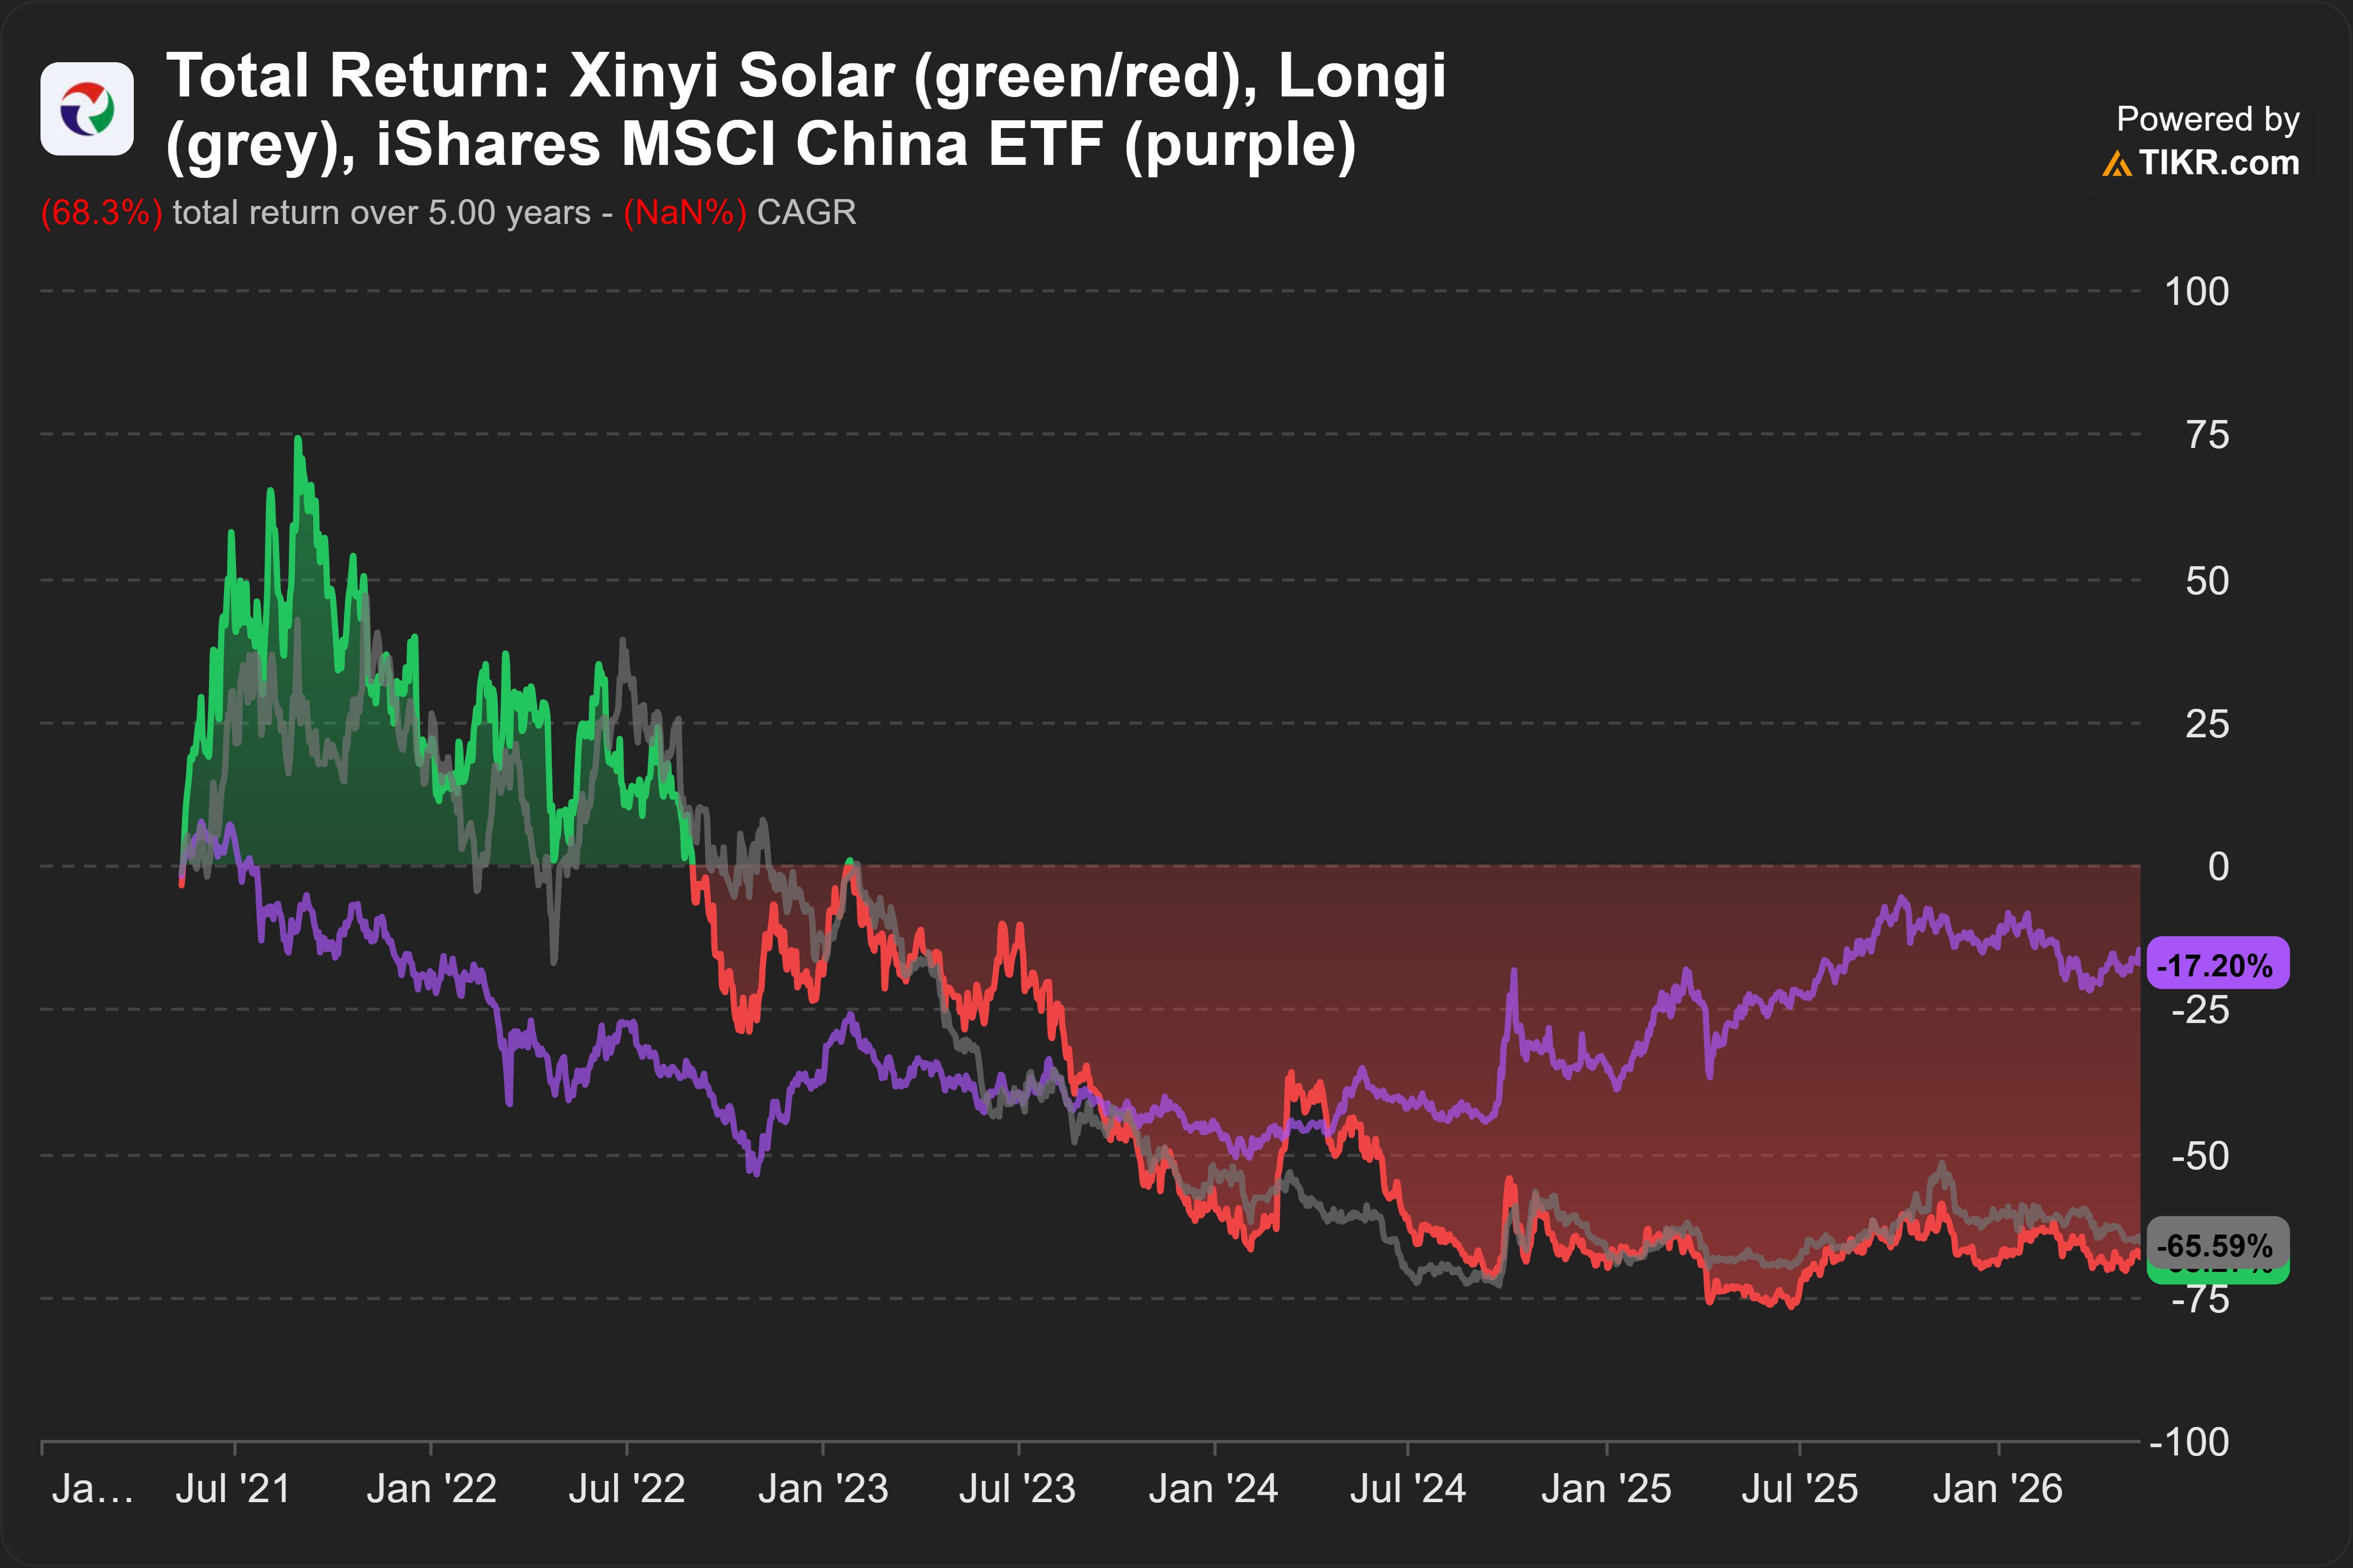
Source: Tikr (2026)
To invest in Xinyi Solar over the long-term, it is important to know where we are in the broader solar industry cycle.
The solar cycle seems to share similarities with the semiconductor cycle. Using the same framework, back in 2024, I created this chart for Jinko Solar.
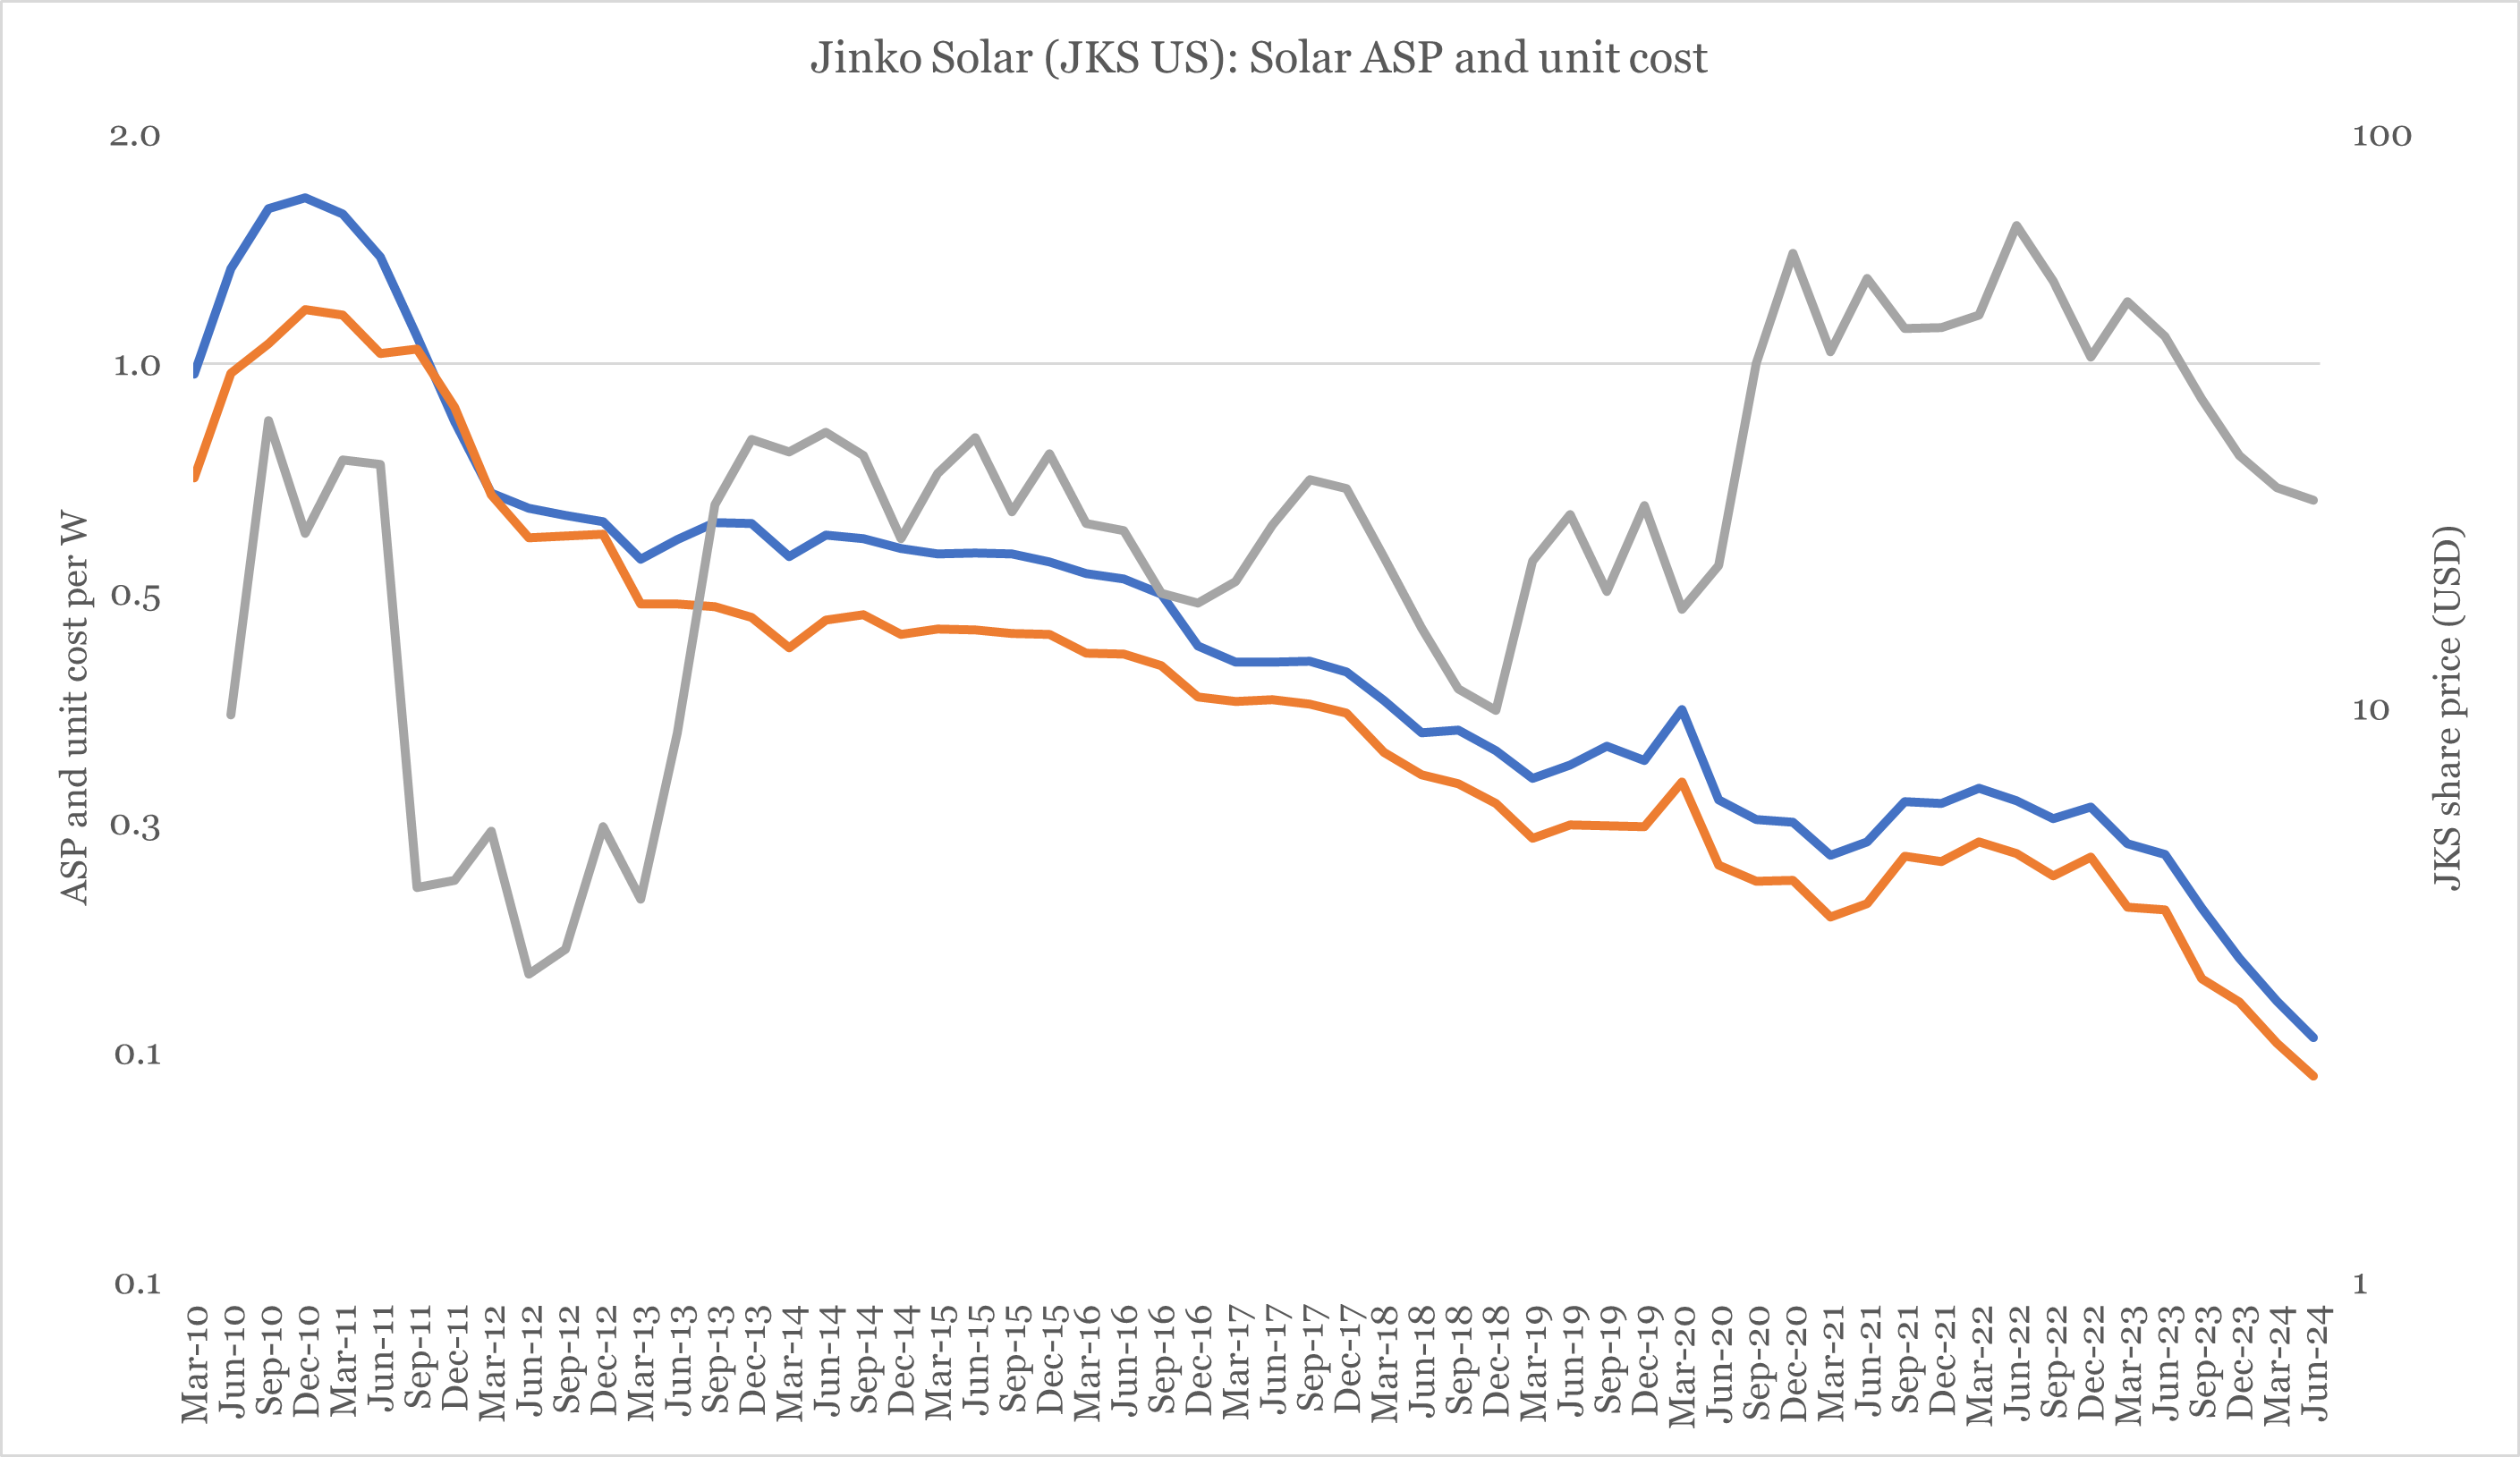
Source: Angsana Anderson’s estimates using Jinko Solar
The average selling price (ASP) and unit cost of JKS’ solar panels seem to offer enough explanatory power. It will be worth exploring this further in a future post.
Long overdue receivables. Tariff adjustment receivables make up ~60% of Xinyi Solar’s total trade receivables.
These receivables represent government subsidies on renewable energy generated by the company’s solar farms.
Xinyi Solar disclosed that 52% of its tariff adjustment receivables pertain to electricity generated over 2 years ago (!).
The government is apparently delaying subsidies payments because of a mounting deficit in China’s renewable energy development fund (REDF). The REDF is funded by renewable surcharge fees levied on consumers. However, considerable political pressure to keep electricity cheap meant difficulty in raising the surcharge fees.7
Such long overdue receivables, even from the government, create a high risk that Xinyi Solar will not receive the cash. A write-down may be necessary. A complete write-down would cost around CNY 4,900 mn, ~135% of 2025’s operating profits.
Until the company starts receiving payments, it may also be prudent for investors to disregard the revenue recognized from tariff adjustments. Such revenue accounted for ~5% of total revenue in 2025.
Perhaps Flat Glass Group Co., Ltd. (6865 HK) offers a better way to invest in the solar industry. Its trade receivables appear healthier because it focuses on making solar glass rather than solar farms.
Coming up next
Lululemon: Lulu or lemon?
Lululemon was a quality compounder. Since 2013, it has always traded around 20x NTM P/E. At its peak during COVID-19 lockdowns, its NTM P/E breached 80x.
Today, Lululemon is selling for only 9x NTM P/E.
Could this be the bargain of our lifetime?
Let’s find out in my next post.
Subscribe for free to be notified immediately when I publish.
Subscribe for 2 to 3 analyses of global SMID equities every week.
Discover overlooked ideas and rethink familiar names.
Published by Andrew Wong, ACA, CFA
Disclaimer
This publication is for informational, educational, and entertainment purposes only and does not constitute financial, investment, legal, or tax advice. The content herein is a record of my personal research and investment process, and all analysis, forecasts, and opinions expressed are solely my own.
I make no representation or warranty, express or implied, as to the accuracy, completeness, or timeliness of the information provided. The stock market is highly volatile, and my forecasts, estimates, and assumptions may prove incorrect.
I am not acting as your financial advisor or fiduciary. You should not rely on any information in this publication to make investment decisions. Under no circumstances will I be held liable for any direct, indirect, or consequential losses or damages arising from your reliance on the content of this publication.
At the time of publication, I do not hold any positions in 968, either long or short. I may change my views, predictions, or personal portfolio positioning at any time without notice.