
Where are we in the semiconductor cycle?
We are probably closer to the peak than most think

In your Micro-Mechanics thesis, you promised to explain why the semiconductor industry is so notoriously cyclical, and why, despite the recent growth, it will likely remain cyclical.
You also promised to explain your framework for forecasting the cycle.
Let’s hear it.
Before I begin, I must make two confessions.
First, I did not discover this framework myself.
I learned the key foundations from Jim Handy of Objective Analysis, and then built on them through my work and experience.
I absolve you. What’s your second confession?
Although I said I will explain the semiconductor cycle, in reality, I will explain the memory chip cycle.
With few exceptions, overall semiconductor growth follows memory growth.
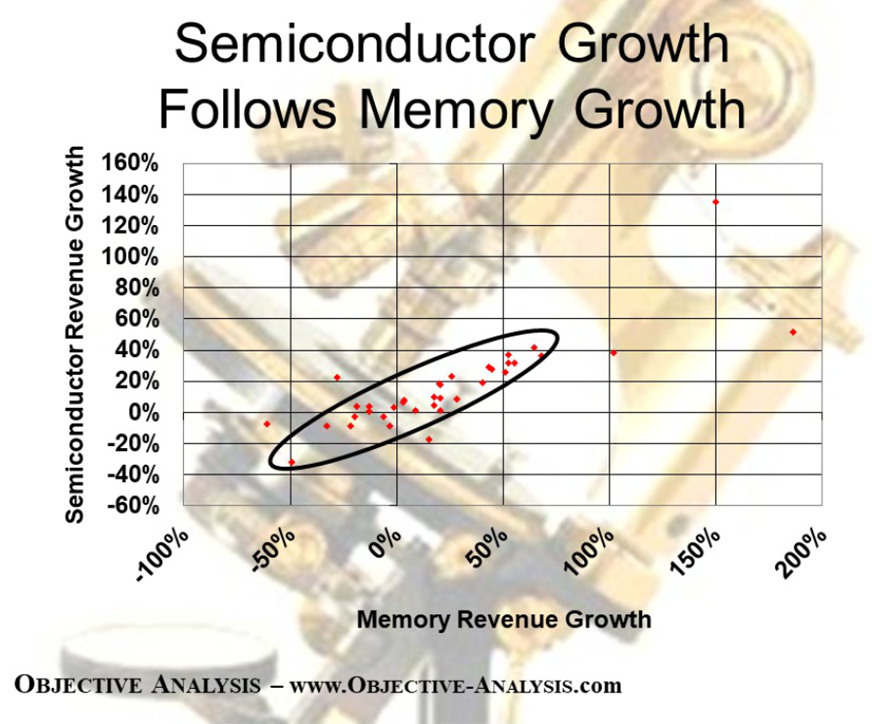
Memory chips make up 25% to 30% of the overall semiconductor market by revenue.1 That’s why the memory cycle is a useful proxy for the broader semiconductor cycle.
If we know the memory cycle, we will have a good understanding of the overall semiconductor cycle.
Sounds good. Let’s get into the memory cycle.
First, the most important memory chips are DRAM and NAND.
They store data. DRAM stores short-term data while NAND stores long-term data. You need both in a computer, smartphone, etc.
That’s all the technical detail you need to know.
What most people don’t fully appreciate is that DRAM and NAND are commodities.
How can such high-tech chips be commodities?
The key characteristic of a commodity is that it is fungible. When something is fungible, it means it is identical and interchangeable.
DRAM and NAND fit this definition. It doesn’t matter whether you use DRAM from Samsung or Micron MU 0.00%↑. They all work the same in your laptop.
Ok. Identical and interchangeable = commodity.
That’s right.
Because memory chips are commodities, it doesn’t matter which supplier you buy from. You just want the cheapest price.
Therefore, suppliers compete mainly on price.
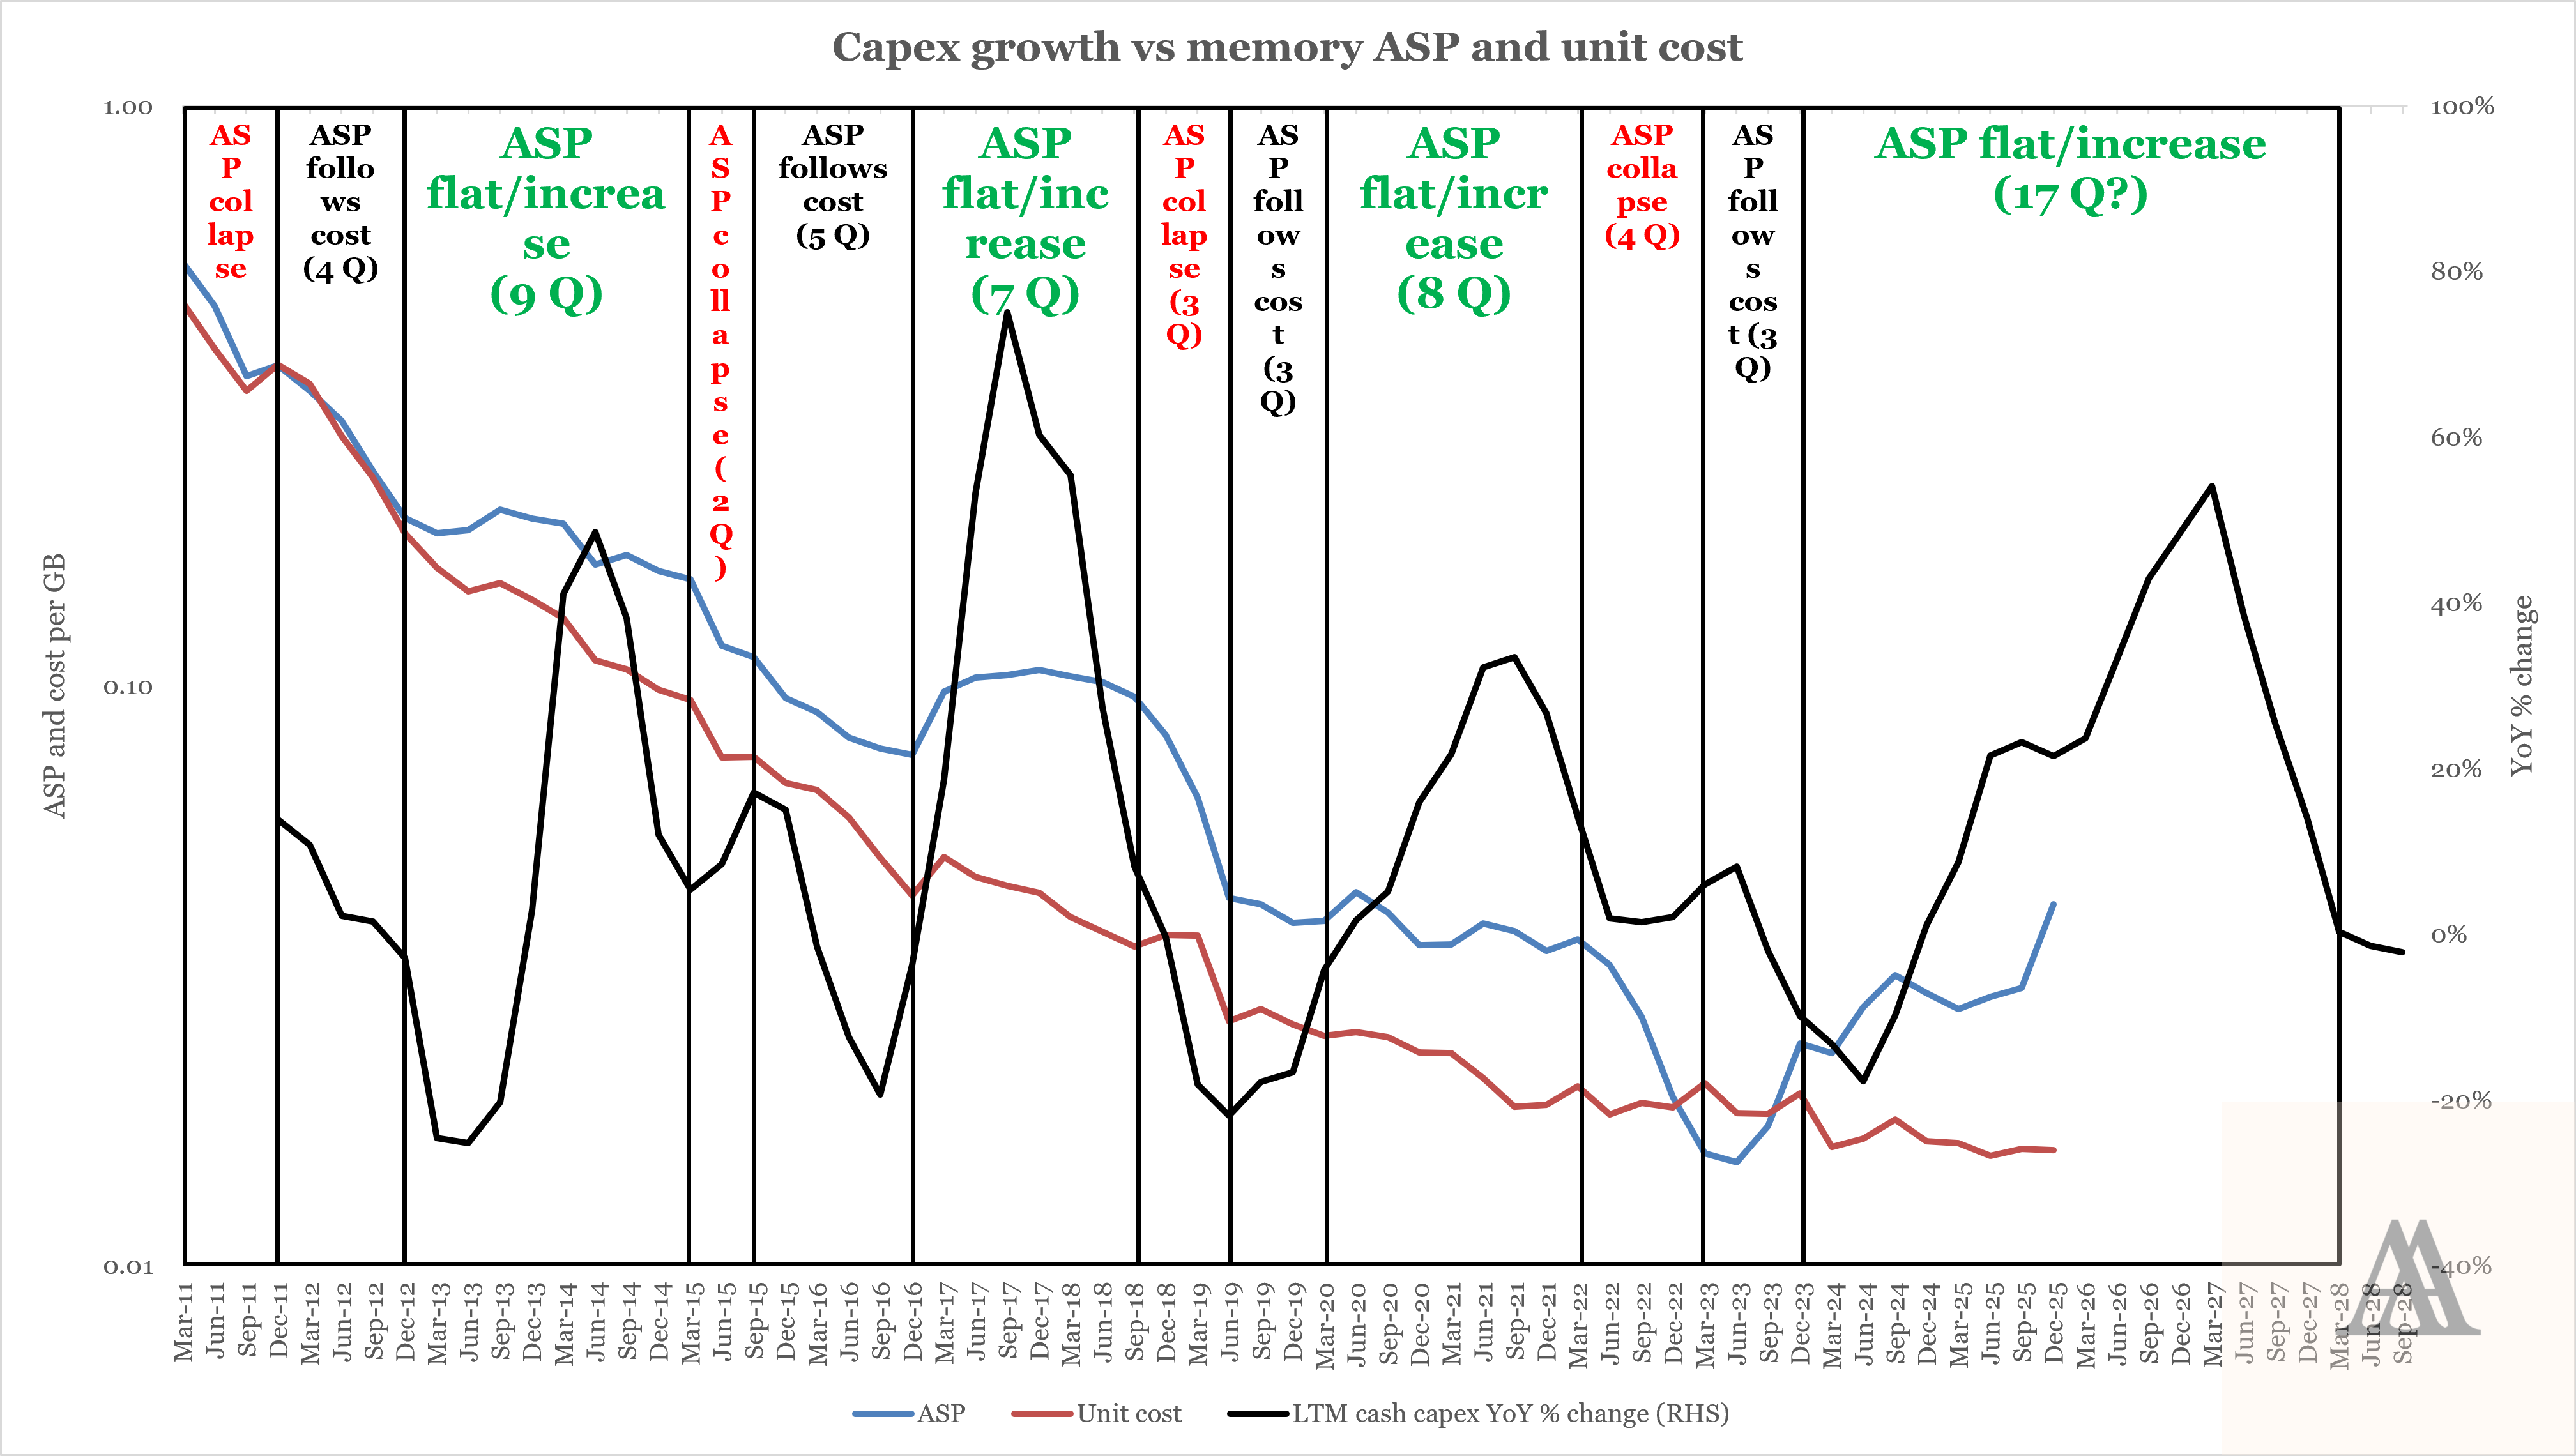
In the chart below, I plot the average selling price (ASP) and cost per GB (unit cost) of DRAM and NAND.
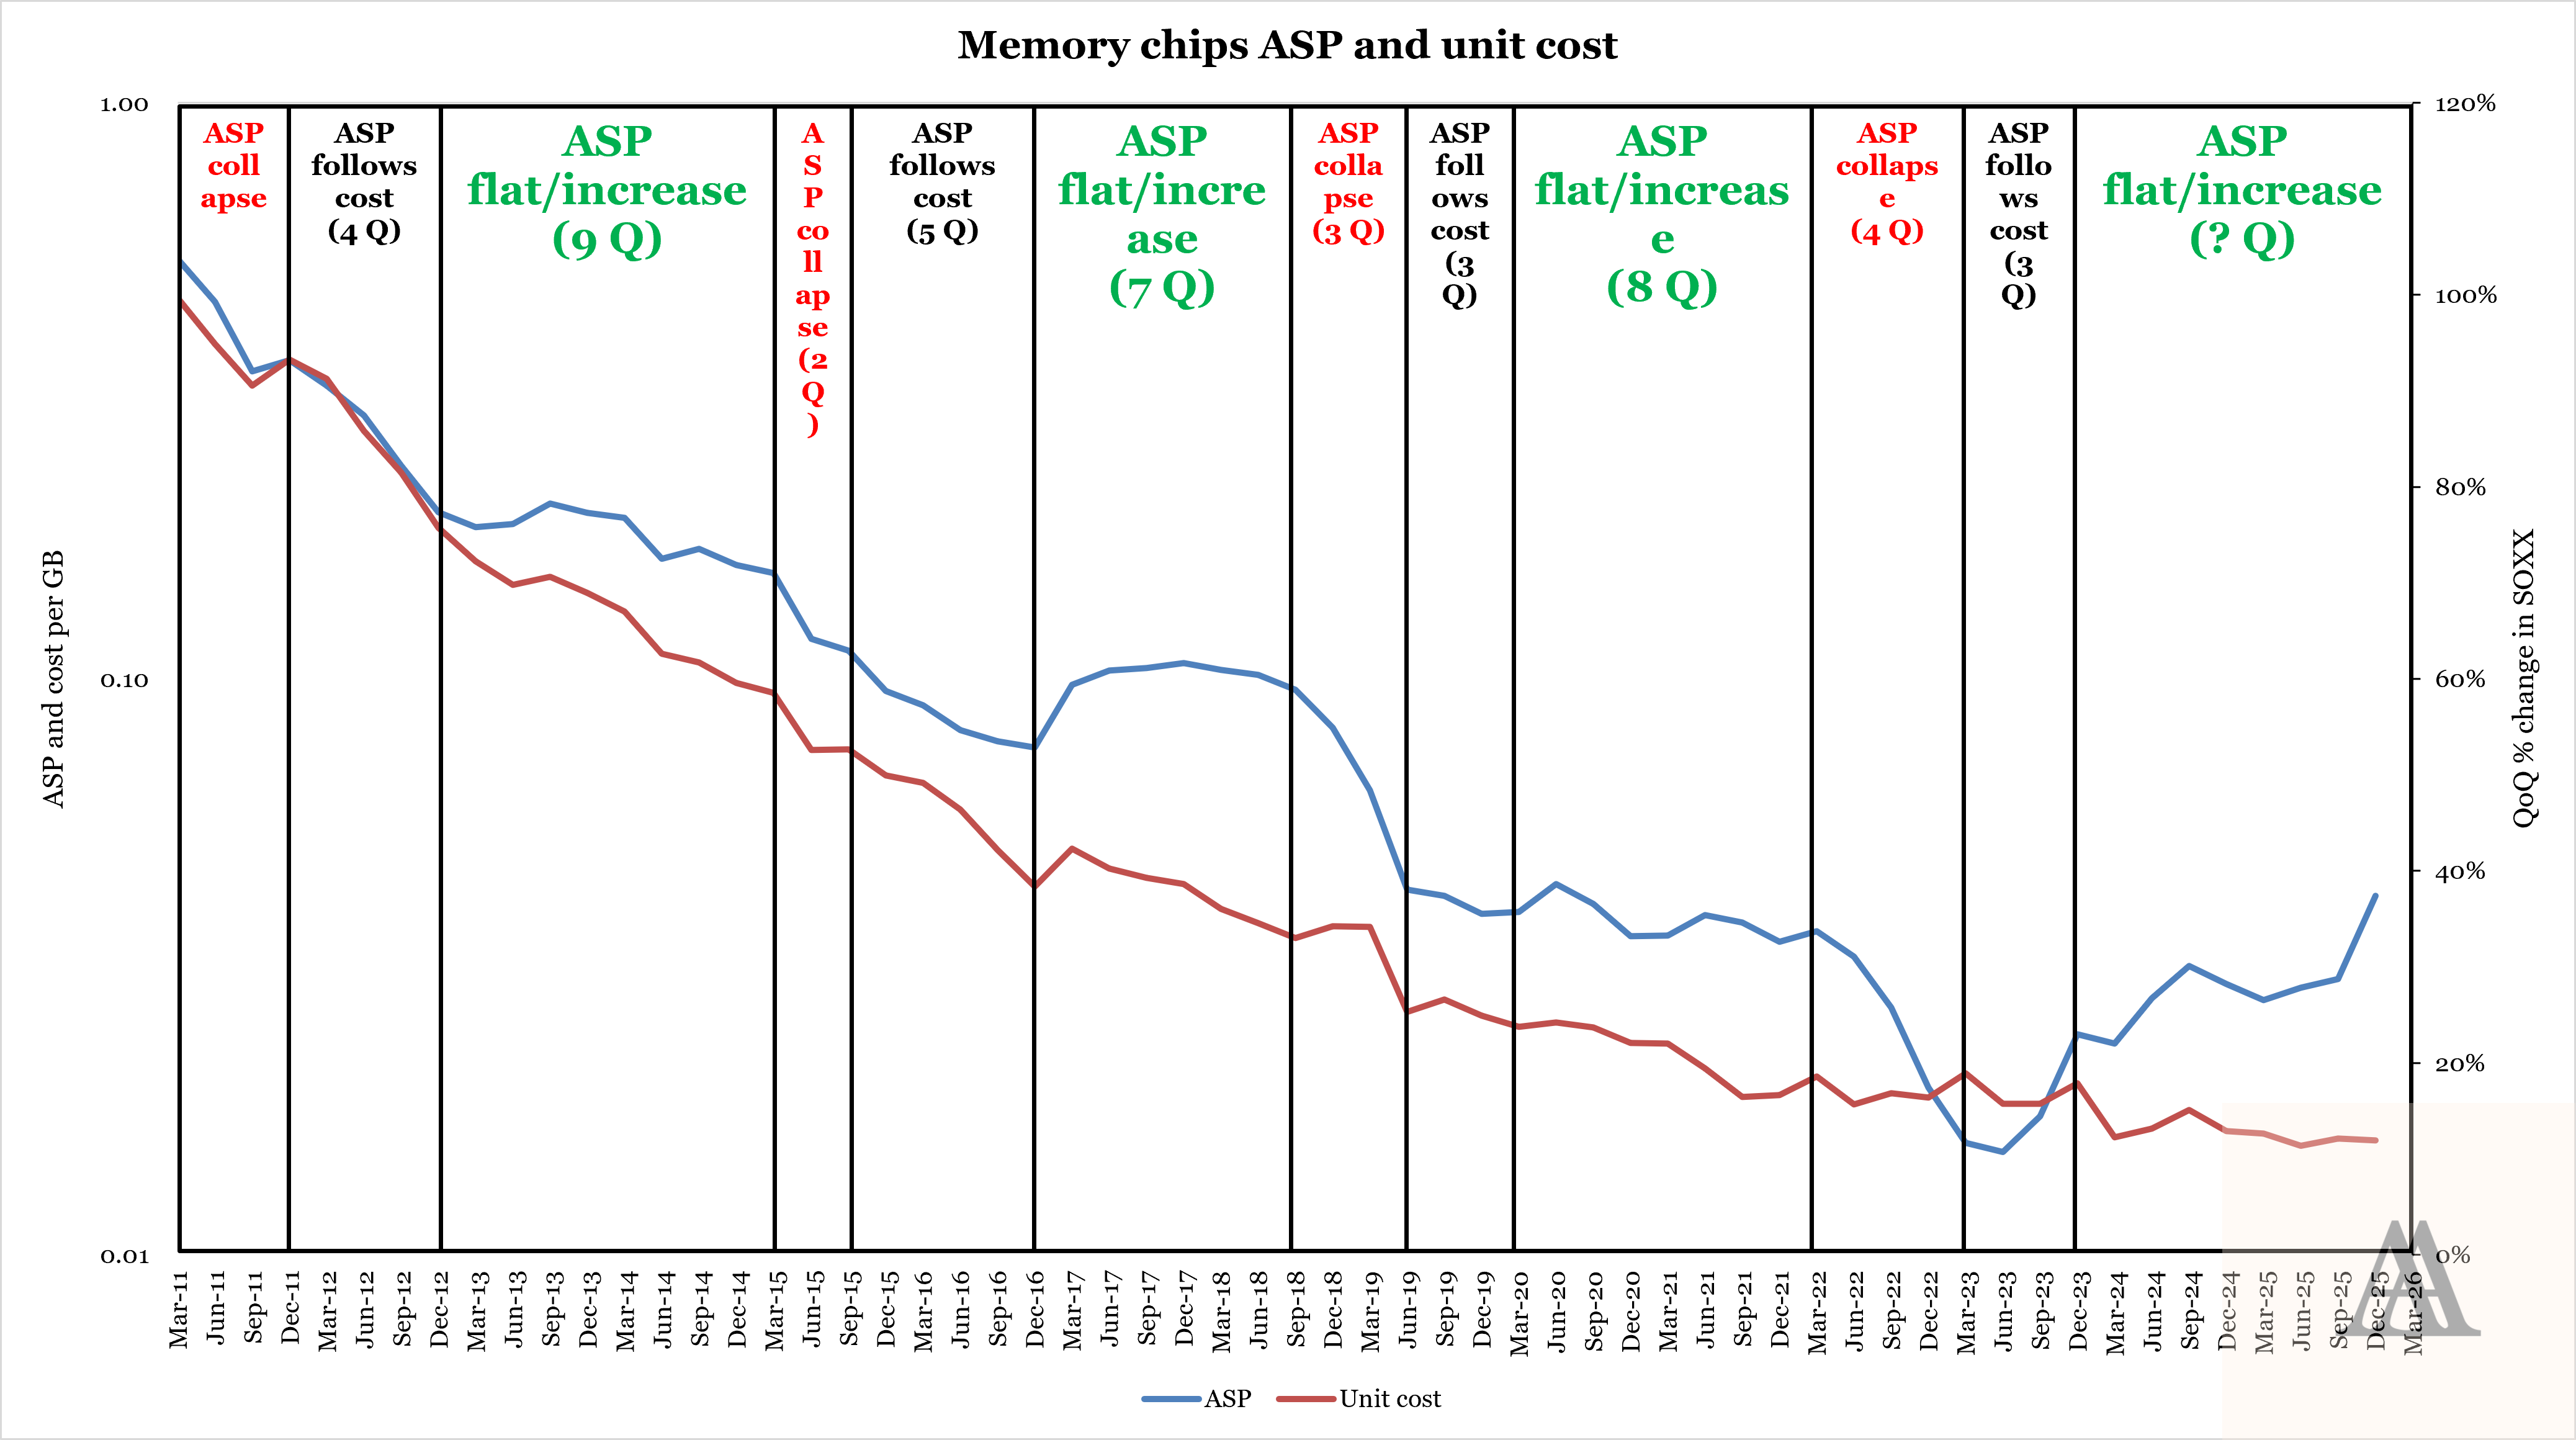
Source: Angsana Anderson’s estimates based on Samsung Electronics, Micron and SK hynix
Explain your chart.
Unit cost declines over time because of technological advancements (Moore’s Law).
As unit cost declines, price competition among suppliers pushes ASP to follow cost. ASP follows cost until we reach a shortage.
During a shortage, ASP flattens or even increases while unit cost continues to decline.
Memory chip makers start raking in outsized profits. They invest these profits into new fabs.
Generally, it takes around 2 years to build new fabs.
When these fabs are completed, they flood the market with memory chips.
The market flips from shortage to oversupply. ASP collapses towards cost. Profits disappear.
Because of lower profits or even losses, memory chip makers start cutting capital expenditures (capex). Supply stops growing.
At the same time, demand continues to grow. ASP recovers and follows cost.
The cycle repeats.
Can you summarise this?
The memory cycle has 3 stages:
ASP follows cost: recovery from oversupply
ASP flattens or increases: shortage
ASP collapses towards cost: oversupply
Which stage are we in now?
I estimate we are now already 9 quarters into the current shortage.
Historically, shortages last only 7 to 9 quarters. If history repeats, we could be near the end of the current shortage.
This method is not quite scientific, isn’t it? It feels borderline astrology?
Shortages end when new fabs are completed.
In the chart below, I plotted historical capex growth against memory ASP and unit cost.
It shows ASP usually collapsed 2 to 4 quarters after capex growth peaked.
The peak signals the heaviest investments have been made, meaning new supply is just quarters away from hitting the market.
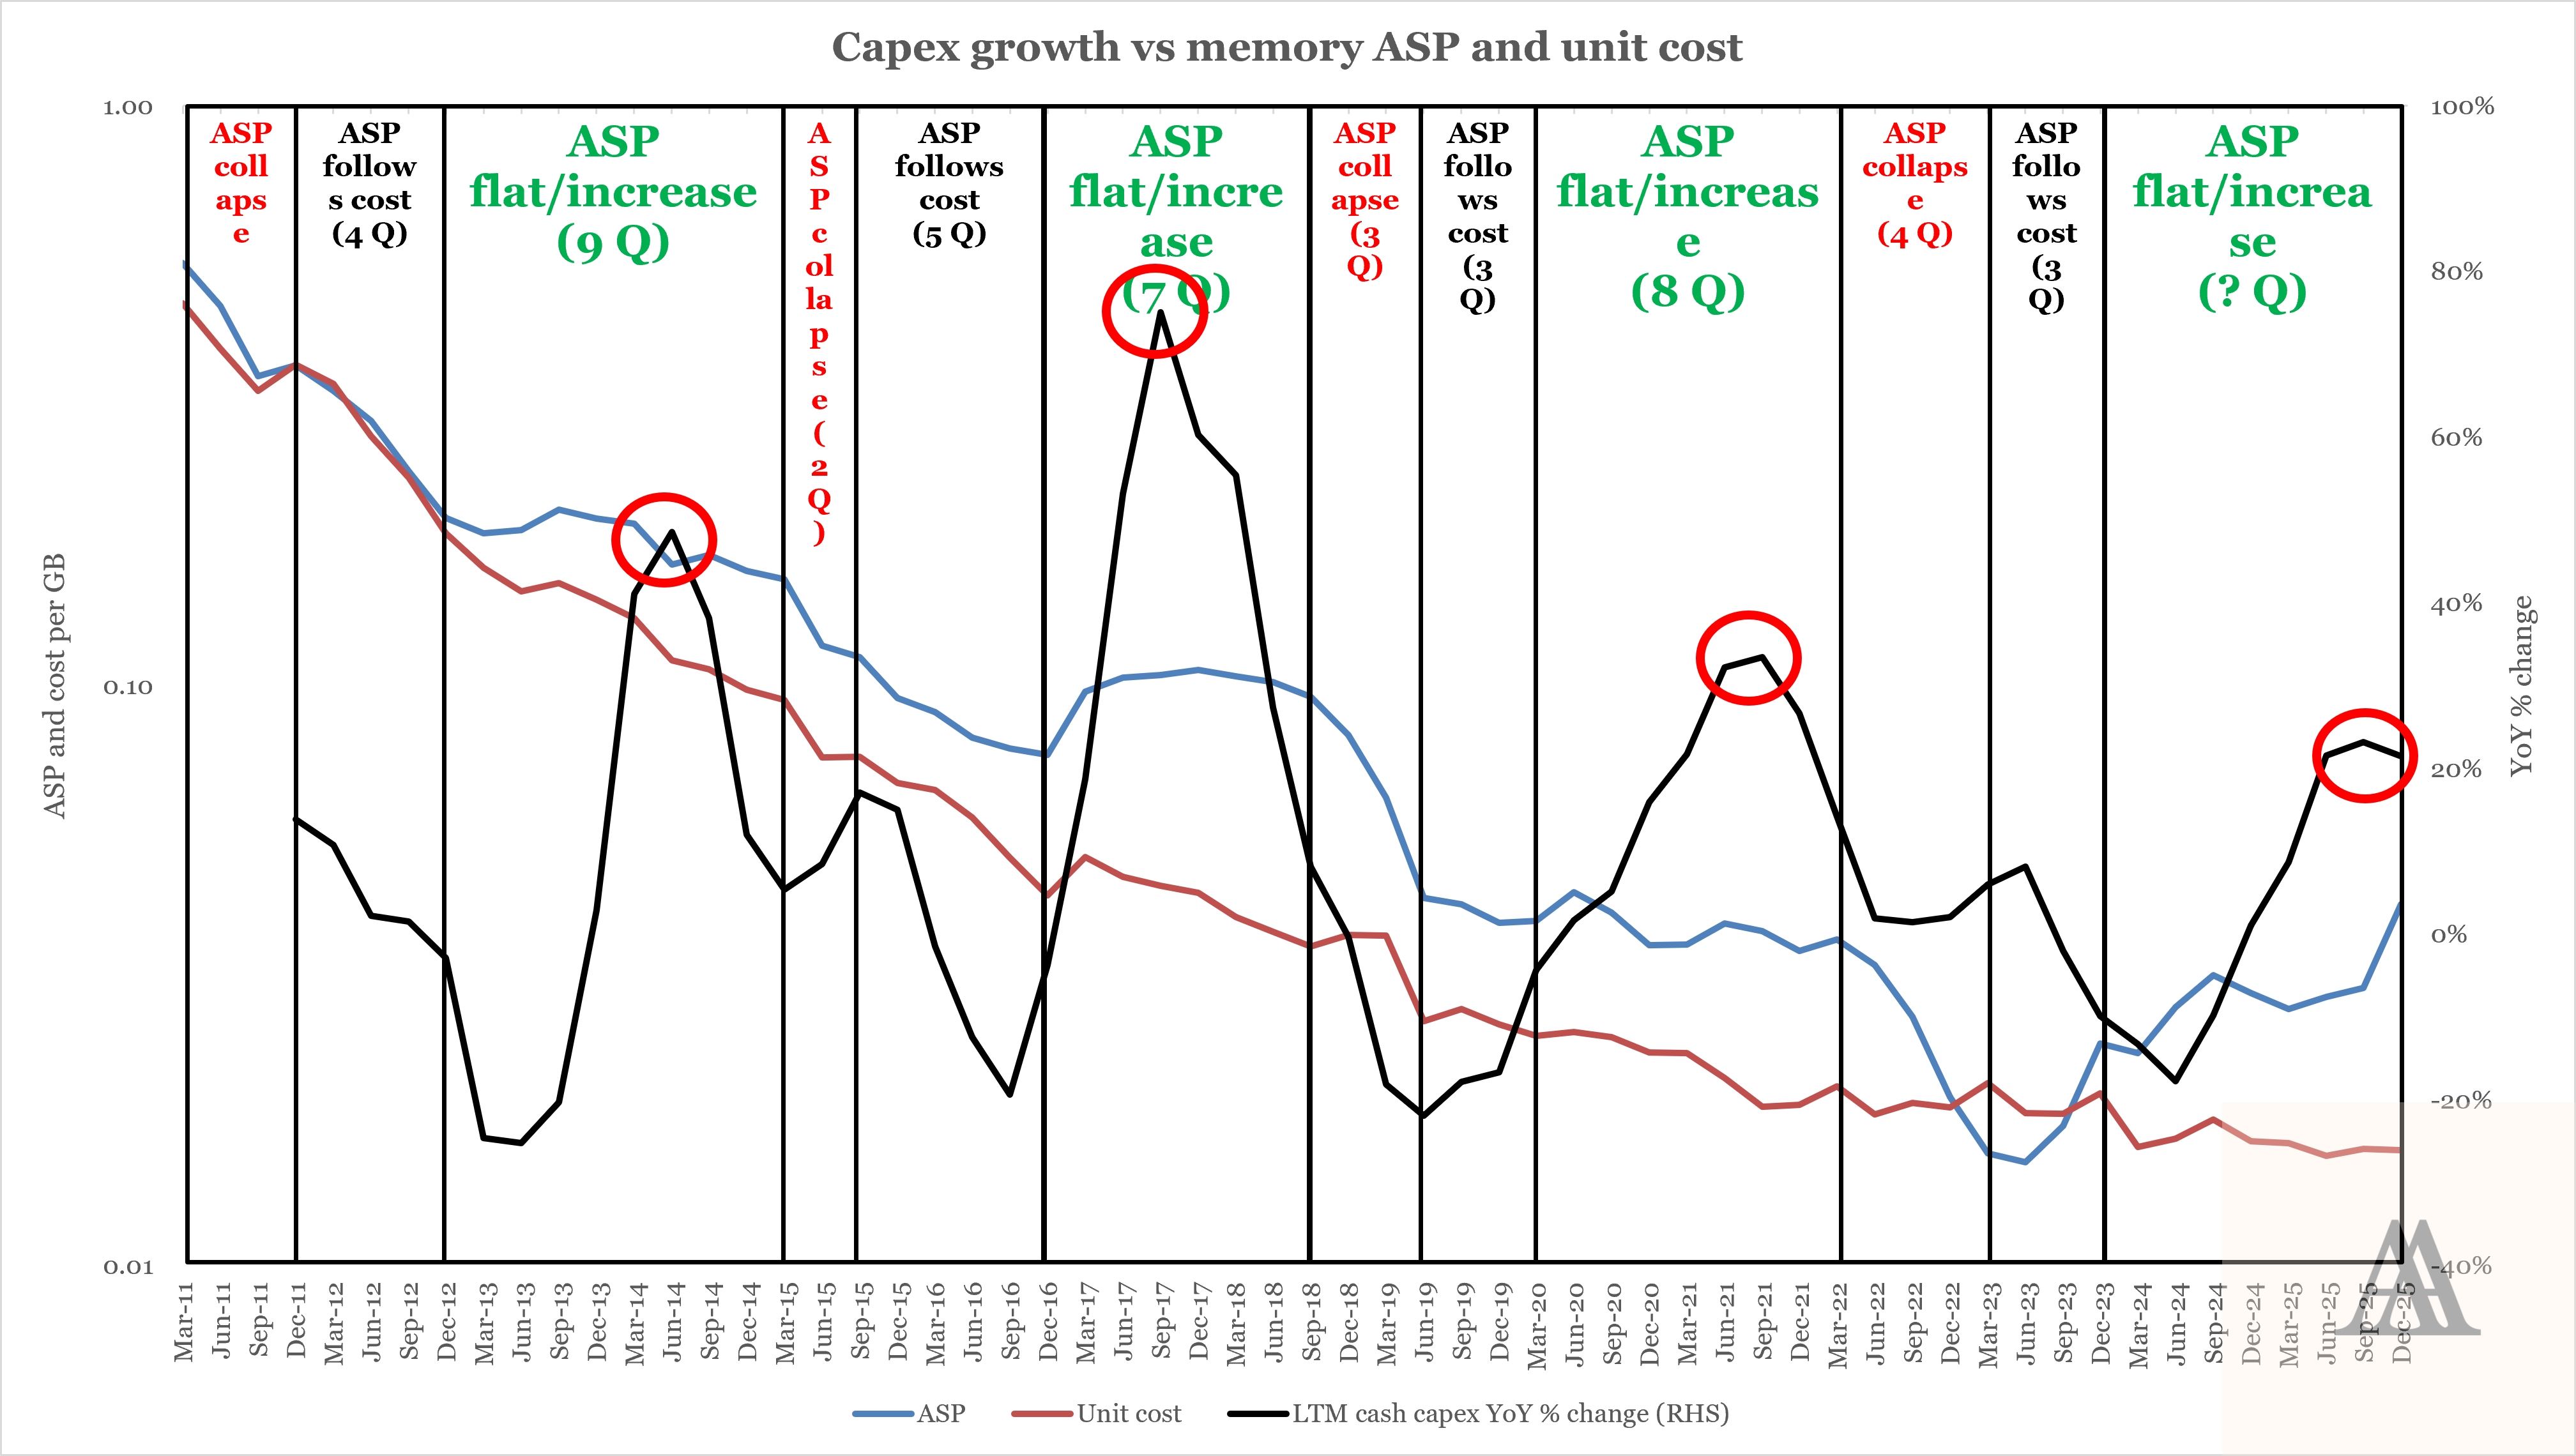
Source: Angsana Anderson’s estimates based on Samsung Electronics, Micron and SK hynix
Capex growth seems to be forming a peak in Q4’25. This suggests the memory market may flip into oversupply within the next 2 to 4 quarters.
What are the implications for investors?
Let me plot the QoQ % change in SOXX against memory ASP and unit cost. SOXX 0.00%↑ refers to the iShares Semiconductor ETF, one of the most popular semiconductor ETFs.
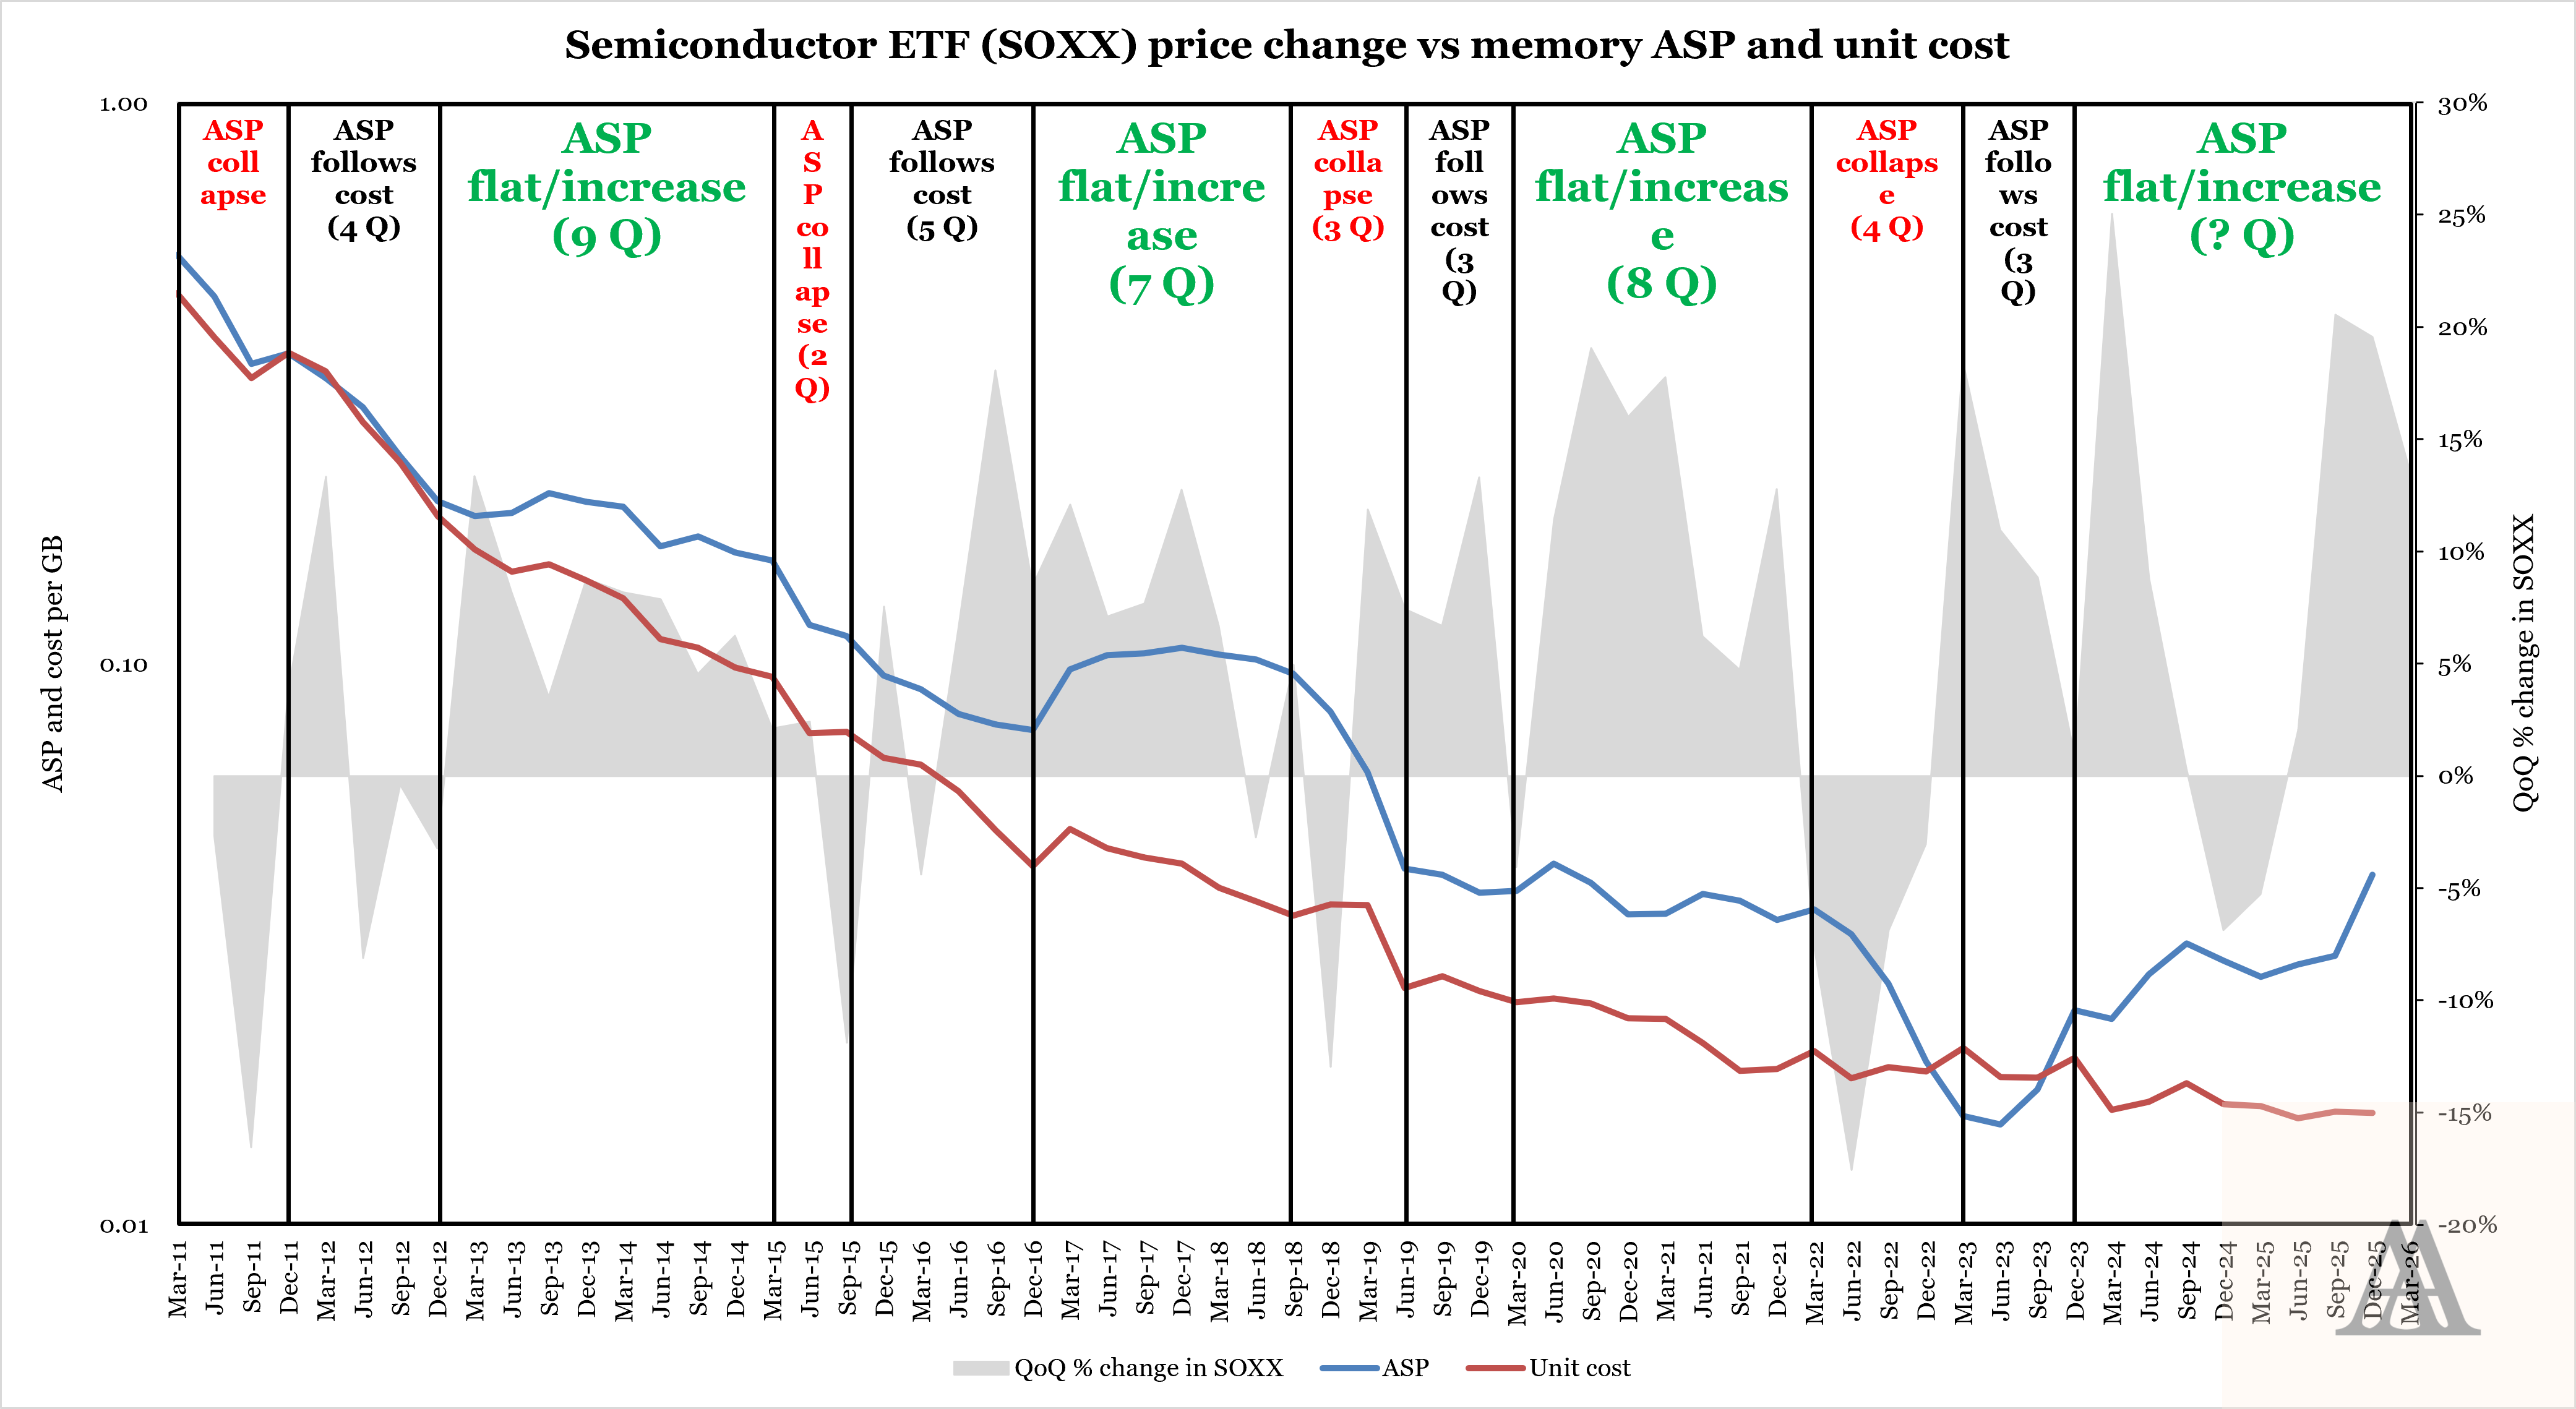
Source: Angsana Anderson’s estimates based on Samsung Electronics, Micron, SK hynix, SOXX
The last shortage ran from 2020 to 2021. Memory chip makers raked in massive profits, catching investors’ attention and fuelling a +160% rally in SOXX.
By early 2022, after two years of extraordinary gains, investors grew euphoric. “This time is different!” They extrapolated the recent growth indefinitely.
Imagine their shock when ASP collapsed around early 2022. The new fabs opened and flipped the market into oversupply. Profits disappeared.
SOXX crashed as investors raced to dump anything related to semiconductors. “No more lousy cyclicals!” Just like in the late stages of the shortage, they extrapolated the oversupply indefinitely.
Chip makers start cutting capex to stem supply growth. When demand, boosted by generative AI, eventually caught up around early 2024, the current shortage began.
The cycle repeats.
Can you be more straightforward?
I don’t provide financial advice or recommendations. But like any other private investor, I can always share my forecasts and how I am positioning my personal portfolio.
I estimate the shortage will end around Q1’27. Capex growth peaked around Q4’25. Historically, ASP starts to collapse 2 to 4 quarters after the peak in capex growth.
Because of forward guidance, investors will start reacting one or maybe two quarters before Q1’27. This means the rally in SOXX will probably end around Q4’26.
Could you be wrong?
There is a chance the shortage ends in Q1’28, a year later than I expect.
Here’s the same chart, but with consensus forecasts of capex growth.
Source: Angsana Anderson’s estimates based on Samsung Electronics, Micron, SK hynix; Tikr
The consensus is forecasting that after a brief pause in Q1’26, capex growth will accelerate and peak only around Q1’27.
If this happens, the shortage will probably end around Q1’28, a year later than I expect. Accordingly, SOXX will likely only start declining in Q4’27.
However, I am skeptical.
For reasons I will discuss later, during shortages, consensus tends to overestimate future capex growth. Time and again, these estimates are revised downward when the shortage begins to ease.
Furthermore, the target production date of new fabs cluster around early 2027. I asked Perplexity to compile data on major memory fabs under construction and their expected production date:
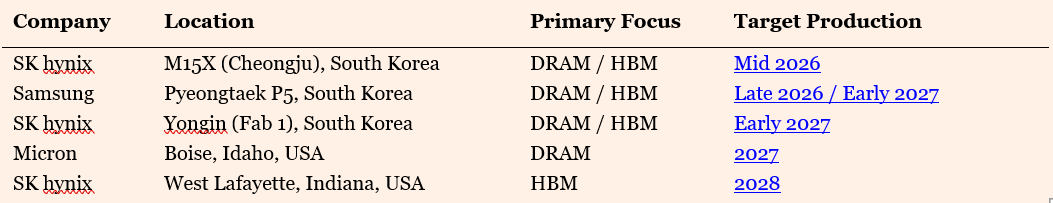
Finally, if the shortage will end only in Q1’28, this would make the current shortage the longest since 2011. At 17 quarters long, this shortage would be twice the duration of the past 3 shortages.
I am confident the current shortage will eventually end. I expect this to happen around Q1’27. If the shortage persists beyond 2027 and into 2028, I would be very surprised.
Why can’t semiconductor companies forecast their demand accurately and avoid oversupply?
I believe there are 2 big reasons.
These 2 reasons also explain why I believe the semiconductor industry will remain cyclical, despite the tremendous growth recently.
First reason: true demand unknown
When a shortage begins, customers start worrying over inventory. So, like any prudent people, they start hoarding inventories.
When distributors order laptops from HP HPQ 0.00%↑, they will order extra to create buffer inventory.
HP receives the order. It is bigger than expected. At the same time, HP also sees the shortage starting.
What does HP do? It plays safe and orders its own buffer inventory!
The same thing happens when laptop manufacturers like Quanta order chips from SK hynix.
By the time SK hynix receives the order, everyone’s buffer inventory will have significantly inflated the true demand.
Isn’t this called the bullwhip effect?
Yes.
A small flick of the wrist creates a massive movement at the end of a whip.
A small change in end-demand causes large fluctuations as orders move up the supply chain.
What’s the second reason?
Inelastic supply.
Suppose SK hynix’s order book consists of 50% true demand and 50% panic-driven buffer inventory. Perceived demand has effectively doubled.
Reacting to this massive signal, SK hynix aggressively scales up its capex, doubling the size of its planned fab and ordering twice as much equipment.
In the meantime, the shortage begins easing. Customers start reducing their buffer inventory and true demand becomes clearer.
By then, it is too late. The shell is built, the equipment is installed and calibrated. Wafers are rolling off the line.
Because semiconductor equipment represents such a massive sunk cost, SK hynix has every incentive to keep pumping out volume to recoup its investments, producing as long as marginal revenue exceeds marginal cost.
What is completely rational for an individual chipmaker is disastrous for the industry.
As every player maxes out their utilization rates to cover fixed costs, the market plunges into a full-blown oversupply.
There is no quick fix. Chipmakers just have to live with it until demand catches up eventually.
Some don’t even live through the oversupply. See Elpida Memory, once the world’s third-largest DRAM maker. It went bankrupt in 2012.2
Coming up next
Micro-Mechanics (Holdings) Ltd. (5DD; MMH SP) released their earnings on Tue 28 Apr 2026 and held their earnings call on Wed 29 Apr 2026.
Is the earnings release good or bad? Is my thesis still on track?
Let me update you in my next post.
After that, I want to highlight a potential opportunity: “Why is South Korea’s largest private education platform trading at only 5x NTM P/E?”
Subscribe for free to be notified immediately when I publish.
Subscribe for 2 to 3 analyses of global SMID equities every week.
Discover overlooked ideas and rethink familiar names.
Published by Andrew Wong, ACA, CFA
Disclaimer
This publication is for informational, educational, and entertainment purposes only and does not constitute financial, investment, legal, or tax advice. The content herein is a record of my personal research and investment process, and all analysis, forecasts, and opinions expressed are solely my own.
I make no representation or warranty, express or implied, as to the accuracy, completeness, or timeliness of the information provided. The semiconductor industry and financial markets are highly volatile, and my forecasts, estimates, and assumptions may prove incorrect. I may change my views, predictions, or personal portfolio positioning at any time without notice.
I am not acting as your financial advisor or fiduciary. You should not rely on any information in this publication to make investment decisions. Always conduct your own independent research and consult with a qualified financial professional before making any investment. Under no circumstances will I be held liable for any direct, indirect, or consequential losses or damages arising from your reliance on the content of this publication.
Thanks AA this is helpful work to frame the cycle. Just a question on your capex/ASP framework, if I look at the big 3 memory players and TSMC, their 2026 capex expectation would far exceed ~20% YoY increase - where the chart shows as capex is ‘peaking’. How do their 2026 capex guidance fit into your framework?
Great article man, actually enjoyed reading it.
Subscribed, would love to have you along too 🙂🙌