

“We are in an AI bubble. It is impossible to predict the semiconductor cycle.”
It’s that time of the year. Fund letters are pouring out.
I agree we are in somewhat of a bubble territory. A student in Seoul used a 500% margin loan and turned USD 15,000 to USD 200,000. Then he lost it all. “I couldn’t breathe”1
But regular readers will know that the semiconductor cycle can be understood.
Last month, I showed how we can use unit prices, costs and capex of memory chips to roughly predict shortages and gluts.
Last week, I introduced the “raw spread”. This is the difference between the growth of raw materials and finished goods. When raw materials grow faster than finished goods, it signals strong demand to come.
Are there any other publicly available leading indicators?
Yes.
Aging of trade receivables
In other words, how many customers are paying on time? Most companies disclose this in the footnotes of their financial statements.2
The basic principle is:
When demand starts weakening, customers start delaying payments.
Let’s test this out on the previous downturn.
How to foresee TSMC’s revenue drop in 2023
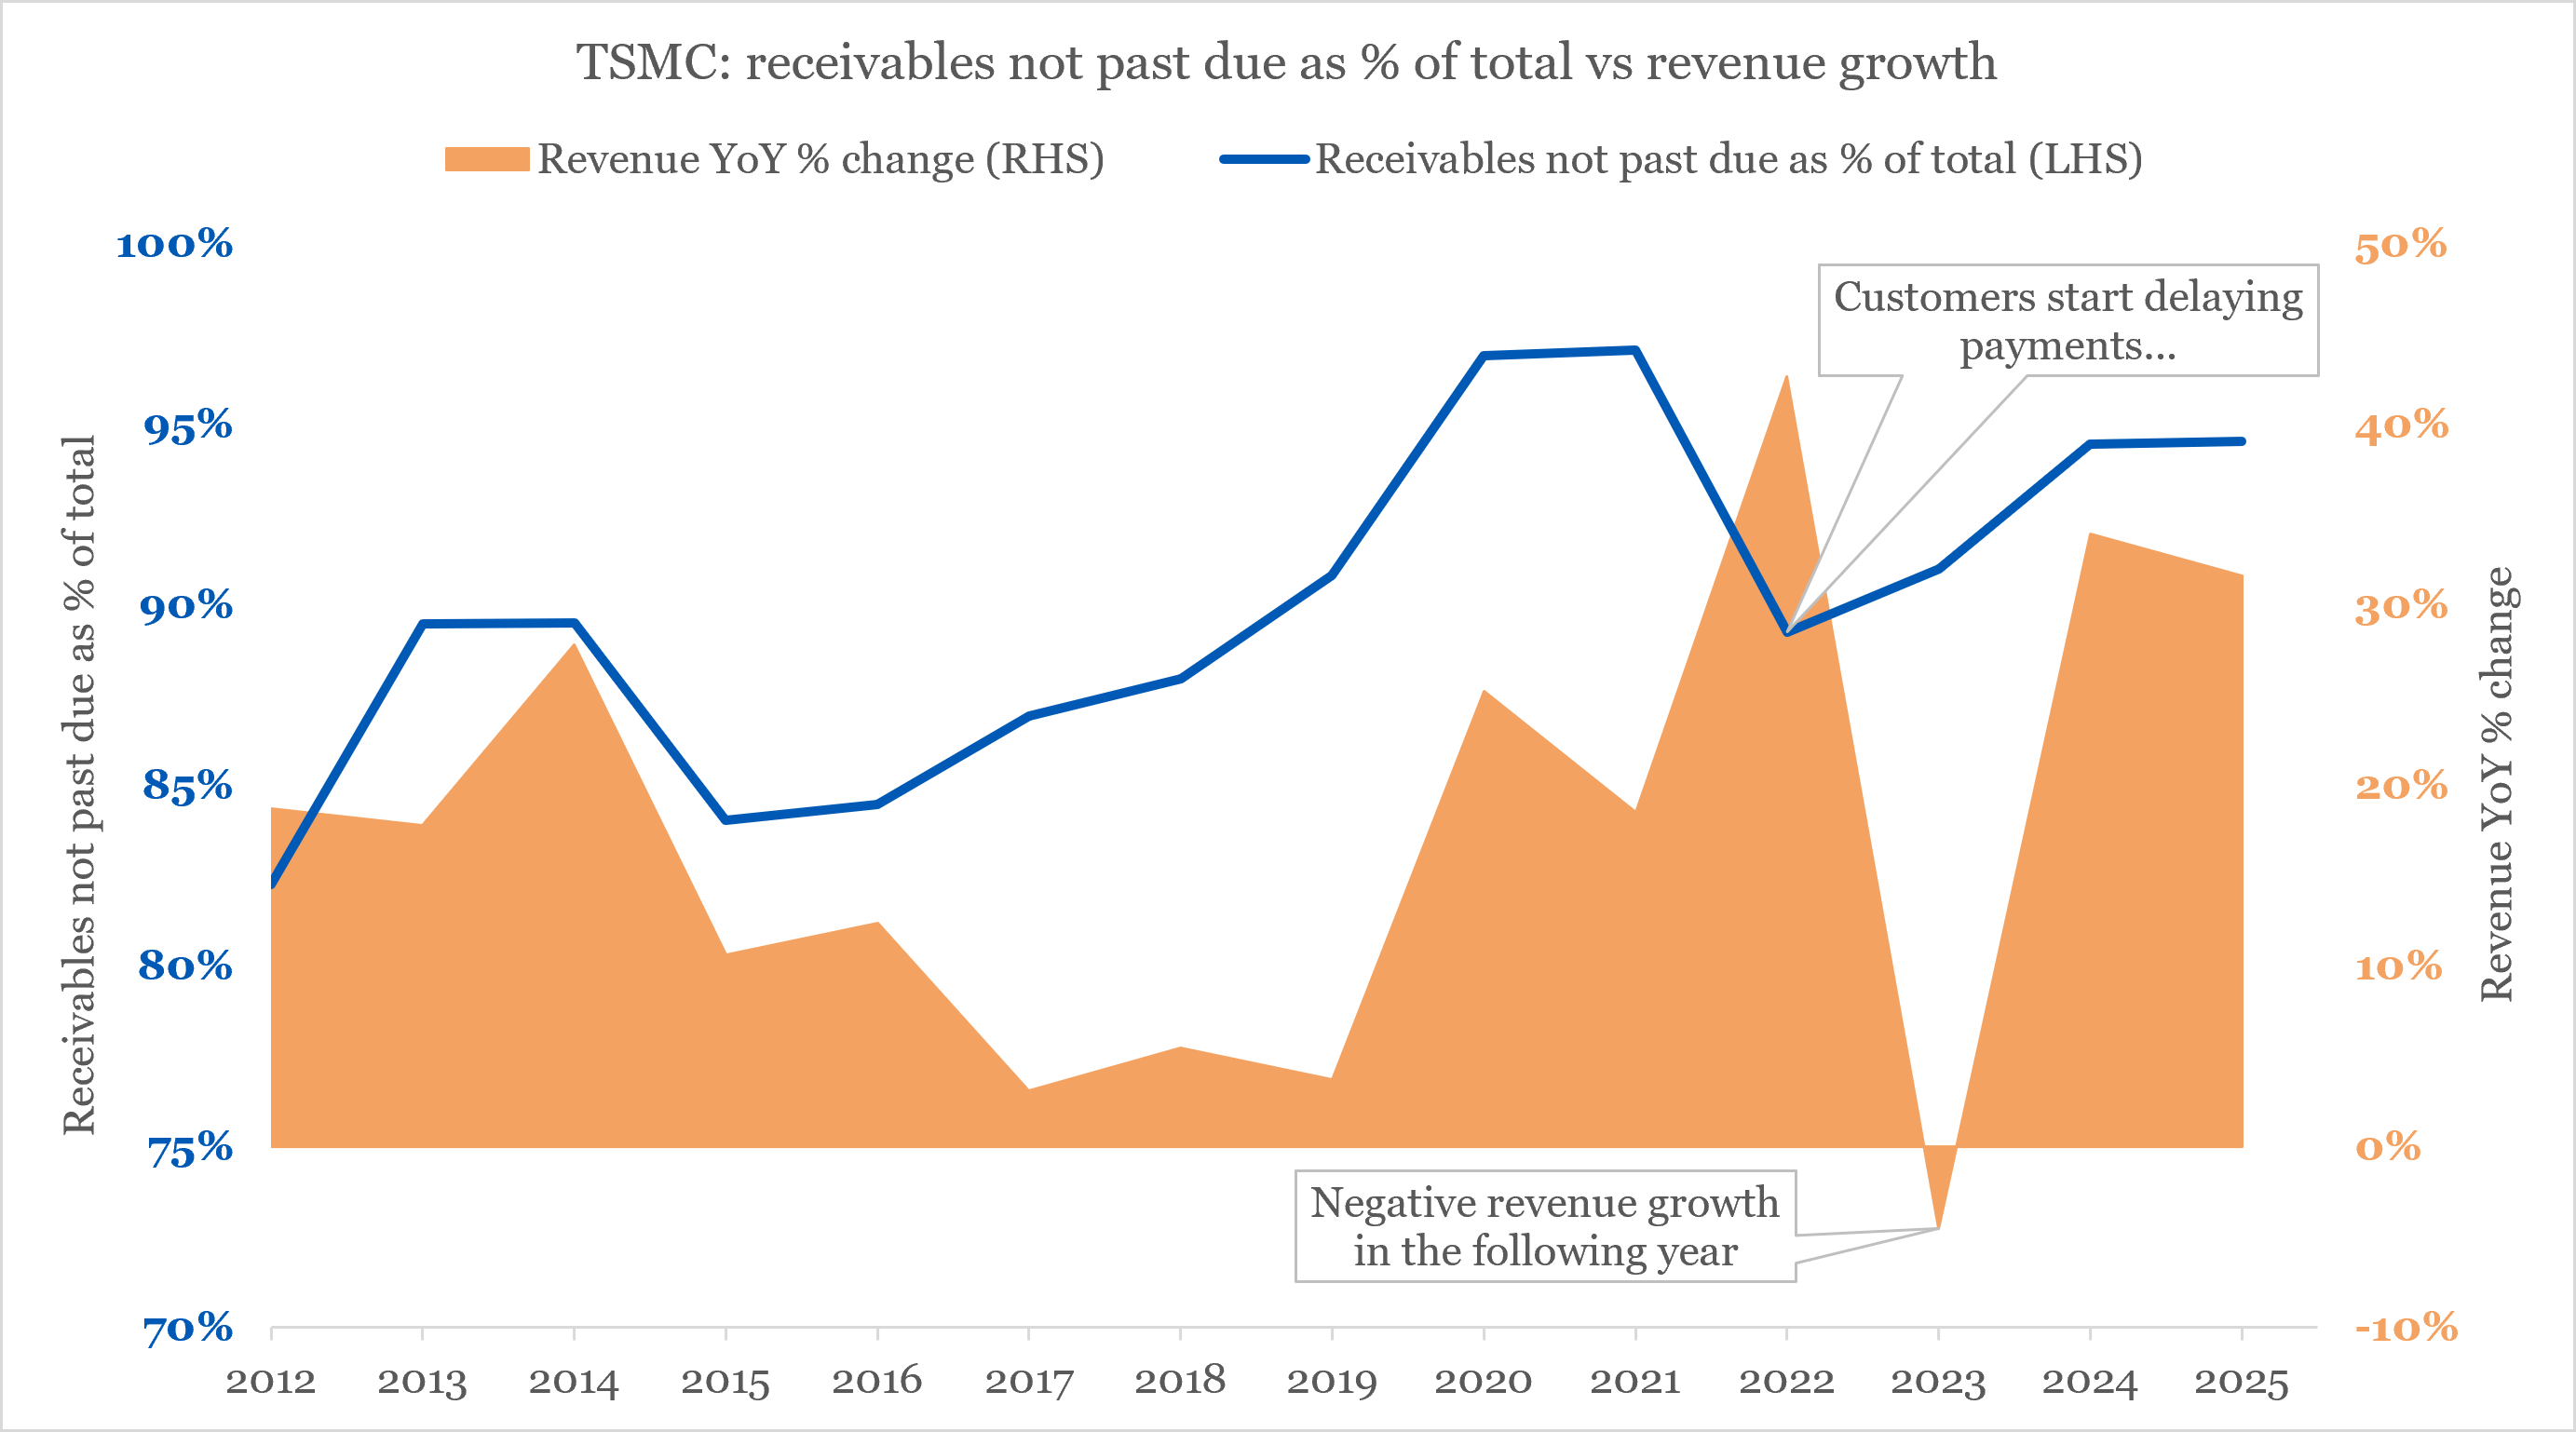
2022 was a great year for TSMC. Revenue growth hit a record high of 43%.
But if you had dug into their footnotes, you could see early signs of demand weakening. Customers were starting to delay payments. The percentage of customers who were paying on time dropped from 97% to 89%.
True enough, revenue declined -5% in the following year:
Source: TSMC, Angsana Anderson estimates
I created this chart using TSMC’s annual financial statements (20-F).
For those who wish to create a higher frequency indicator, good news. TSMC also discloses its receivables aging analysis in their quarterly financial statements. I’ll leave the fun of extracting the data to you (or your LLM).
Coming up next!
Next week, I’ll be back with 3 more interesting ideas.
I’ll then analyse ENN Energy Holdings Limited (2688 HK) in detail. That’s the idea voted most interesting last week.
Thanks for reading! If you found this helpful, hit the “like” button.
If you’re not already a subscriber, sign up for weekly analysis on global SMID equities, including semiconductors.
Disclaimer
This publication is for informational, educational, and entertainment purposes only and does not constitute financial, investment, legal, or tax advice. The content herein is a record of my personal research and investment process, and all analysis, forecasts, and opinions expressed are solely my own.
I make no representation or warranty, express or implied, as to the accuracy, completeness, or timeliness of the information provided. The stock market is highly volatile, and my forecasts, estimates, and assumptions may prove incorrect.
I am not acting as your financial advisor or fiduciary. You should not rely on any information in this publication to make investment decisions. Under no circumstances will I be held liable for any direct, indirect, or consequential losses or damages arising from your reliance on the content of this publication.
At the time of publication, I do not hold any positions in TSM US, either long or short. I may change my views, predictions, or personal portfolio positioning at any time without notice.
References
Most companies except US ones. US GAAP does not require aging analysis for ordinary trade receivables due within one year.